


我们的团队有超过700万的操盘手!
我们每天都在一起努力改善交易。我们得到了很高的成绩,并继续前进。
世界各地数以百万计的操盘手的认可是我们工作的最大赞赏! 您做出了您的选择,我们将尽一切努力来满足您的期望!
我们是一个共同的伟大团队!
InstaSpot. 自豪地为您工作!


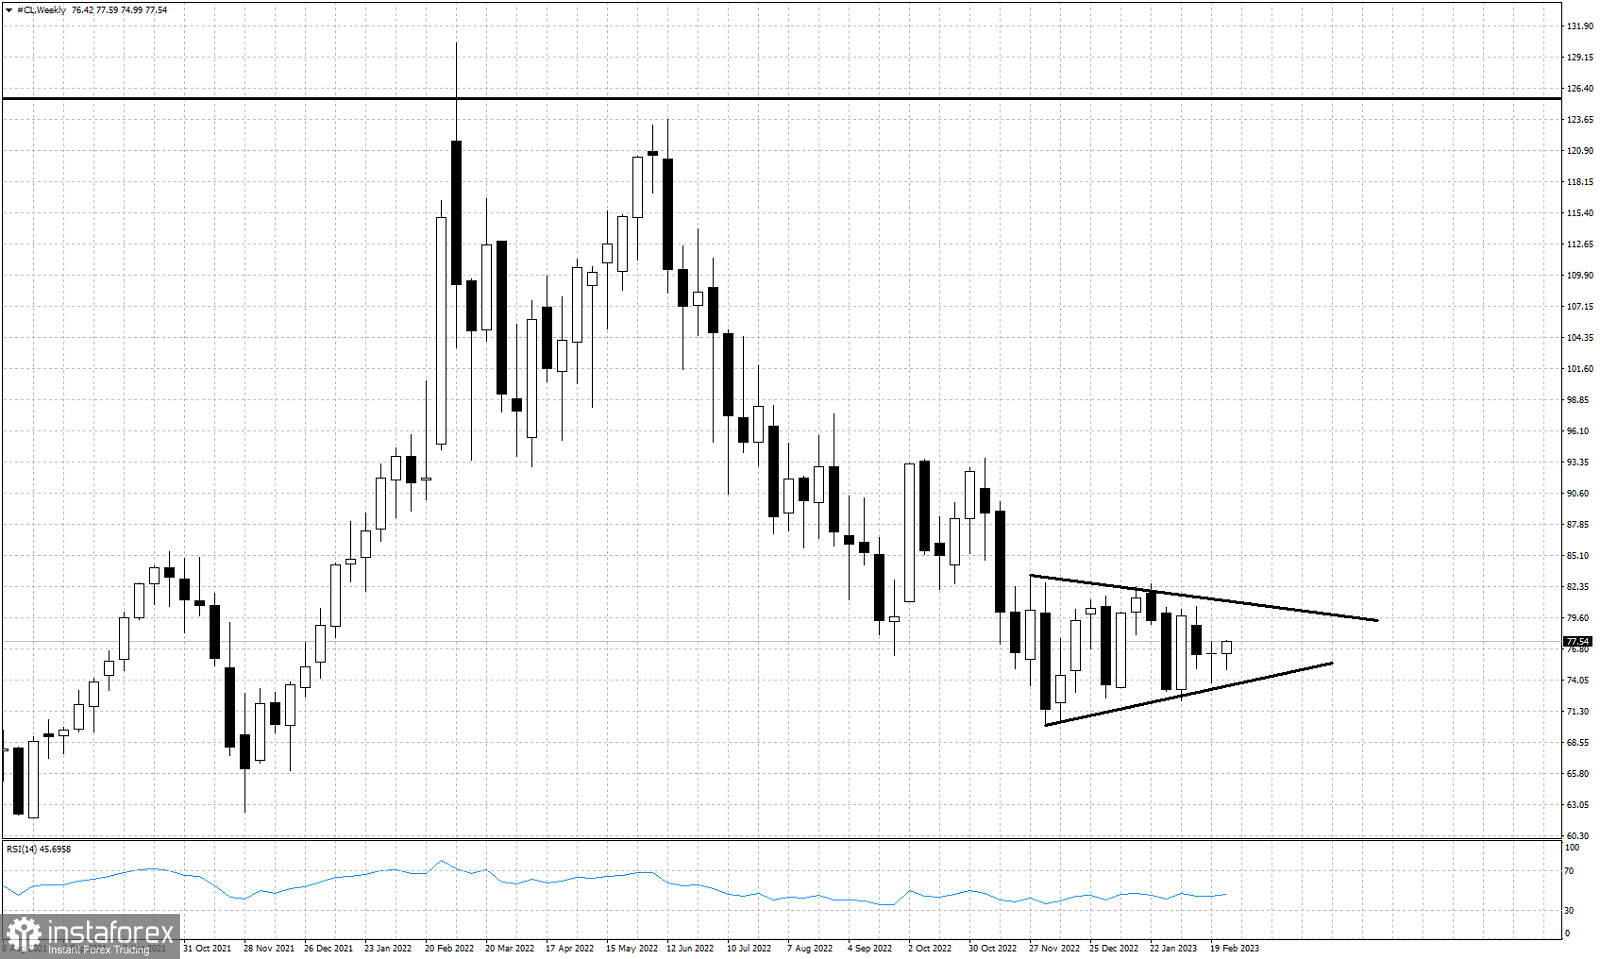
Black lines- triangle pattern
Oil price is trading around $77.50 at the last trading day of February. Price has made no real progress over the last 15 weeks. Price is trapped inside a trading range between $80 and $70. Near term trend is neutral with no clear direction. Price has formed a triangle pattern over the last 13 weeks. The upper triangle boundary is resistance at $80.70 and the lower triangle boundary provides support at $73.50.
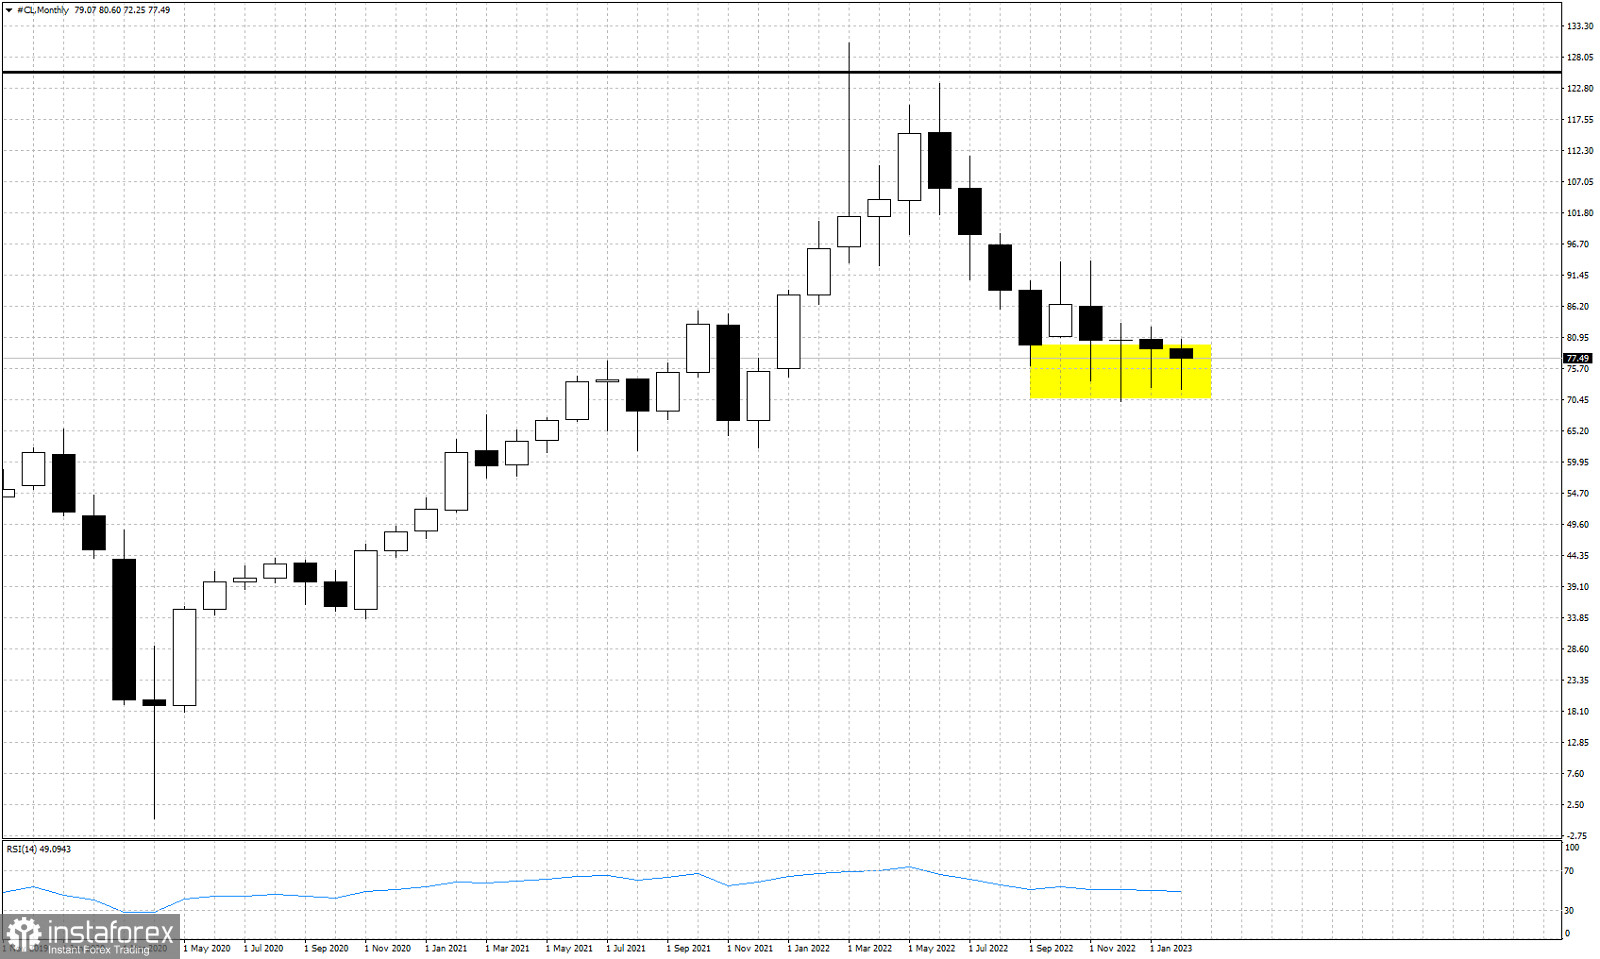
Yellow rectangle- support area
Over the last 4 months the candlestick pattern shows long lower tails. Such candlestick pattern is seen near the lows or the end of a trend. Oil price candlesticks confirm the importance of support around $70. Failure to hold above this level on a weekly and monthly basis would be a bearish sign.
*这里的市场分析是为了增加您对市场的了解,而不是给出交易的指示。
InstaSpot分析评论将让您充分了解市场趋势! 作为InstaSpot的客户,您将获得大量的免费服务以实现有效的交易。


