


ตำนานแห่งทีม InstaSpot!
ที่สุด! คุณคิดว่าอะไรคือการทำให้รู้สึกฮึกเหิมกันละ? แต่พวกเราควรจะเรียกคนที่กลายมาเป็นชาวเอเชียคนแรกที่คว้าแชมป์หมากรุกระดับโลกรุ่นเยาวชนอายุ 18 ปี และยังกลายมาเป็นแกรนด์มาสเตอร์ชาวอินเดียคนแรกด้วยอายุ 19ปีเท่านั้น? นั้นเป็นจุดเริ่มต้นของเส้นทางสู่การเป็นแชมป์โลกสำหรับคุณ Viswanathan Anand คนที่กลายมาเป็นส่วนหนึ่งในหน้าประวติศาสตร์หมากรุกไปตลาดกาล ตอนนี้ก็มีอีกตำนานมาอยู่ในทีม InstaSpot แล้ว!


Borussia เป็นหนึ่งในสโมสรฟุตบอลขึ้นชื่อในประเทศเยอรมนี ที่ได้พิสูจน์ให้กับเหล่าแฟนๆเห็นแล้วถึงจิตวิญญาณของการแข่งขัน และการขึ้นมาสู่จุดสูงสุด เพื่อจะมุ่งหน้าสู่ความสำเร็จ การเทรดเองก็เหมือนกับการเล่นกีฬาอย่างมืออาชีพในการแข่งขัน โดยต้องมีความมั่นใจและการไม่หยุดนิ่ง เพื่อที่จะได้ "ผ่าน" จากสโมสร Borussia FC และขึ้นมาอยู่ในอันดับต้นไปพร้อมกับ InstaSpot!

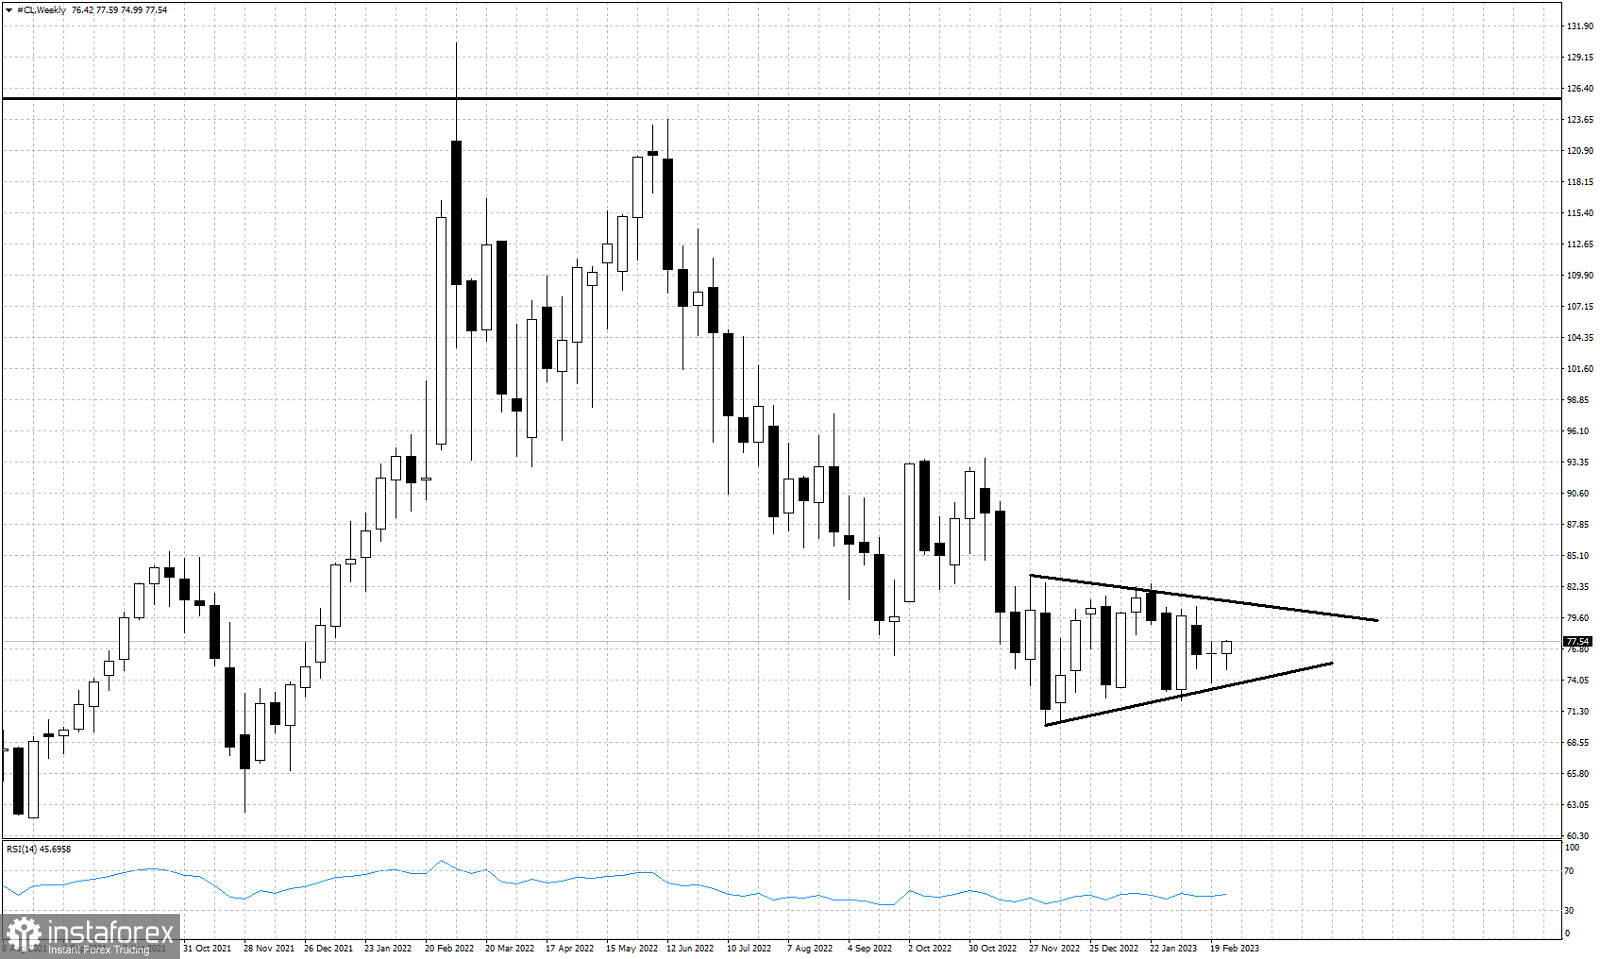
Black lines- triangle pattern
Oil price is trading around $77.50 at the last trading day of February. Price has made no real progress over the last 15 weeks. Price is trapped inside a trading range between $80 and $70. Near term trend is neutral with no clear direction. Price has formed a triangle pattern over the last 13 weeks. The upper triangle boundary is resistance at $80.70 and the lower triangle boundary provides support at $73.50.
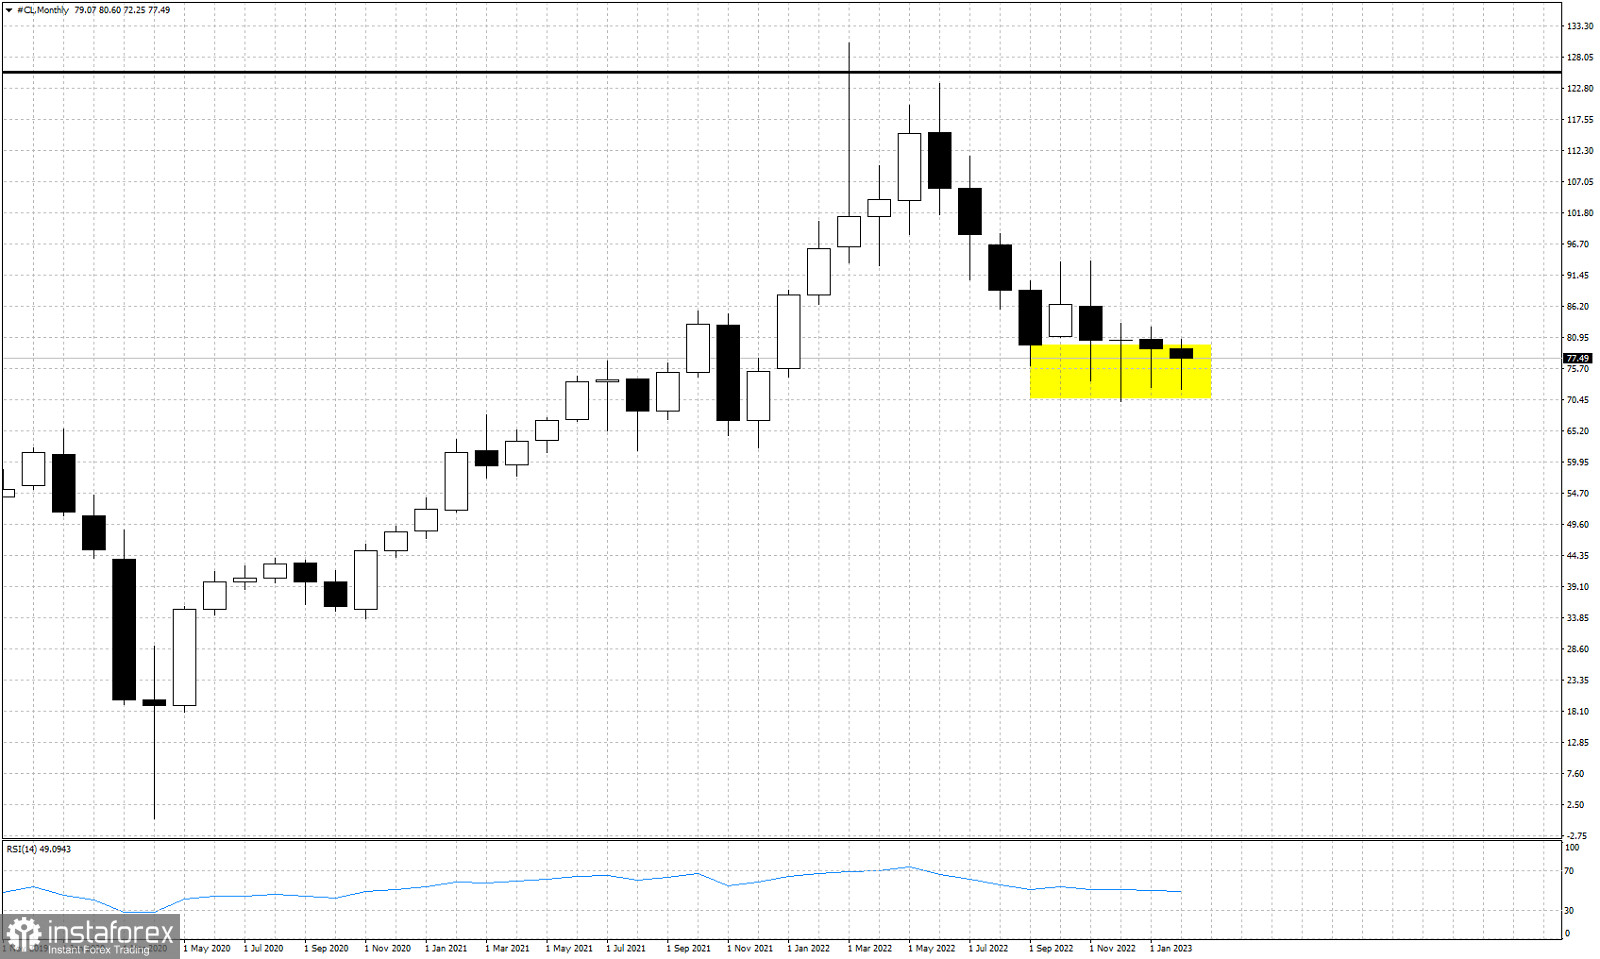
Yellow rectangle- support area
Over the last 4 months the candlestick pattern shows long lower tails. Such candlestick pattern is seen near the lows or the end of a trend. Oil price candlesticks confirm the importance of support around $70. Failure to hold above this level on a weekly and monthly basis would be a bearish sign.
*บทวิเคราะห์ในตลาดที่มีการโพสต์ตรงนี้ เพียงเพื่อทำให้คุณทราบถึงข้อมูล ไม่ได้เป็นการเจาะจงถึงขั้นตอนให้คุณทำการซื้อขายตาม
บทวิเคราะห์ของทาง InstaSpot จะทำให้คุณทราบถึงแนวโน้มของตลาด! ในการที่เป็นลูกค้าของทาง InstaSpot นั้นคุณจะได้รับการบริการเพื่อการซื้อขายอย่างเต็มประสิทธิภาพอย่างมากมาย


