


La leggenda nel team InstaSpot!!
Legenda! Pensi che sia troppo patetico? Ma come dobbiamo chiamare un uomo, che è diventato il primo dell'Asia a vincere il campionato mondiale di scacchi a 18 anni e che è diventato il primo Gran Maestro indiano a 19? Fu l'inizio di un duro cammino verso il titolo di campione del mondo, l'uomo che divenne per sempre una parte della storia di scacchi. Un'altra leggenda nel team InstaSpot!


Il Borussia è una delle squadre di calcio più titolate in Germania, che ha ripetutamente dimostrato ai tifosi che lo spirito di competizione e leadership porta al successo. Fai trading nello stesso modo in cui lo fanno i professionisti dello sport - fiduciosamente e attivamente. Segui il Borussia FC e sii avanti con InstaSpot!

Monday was traditionally accompanied by an empty macroeconomic calendar.
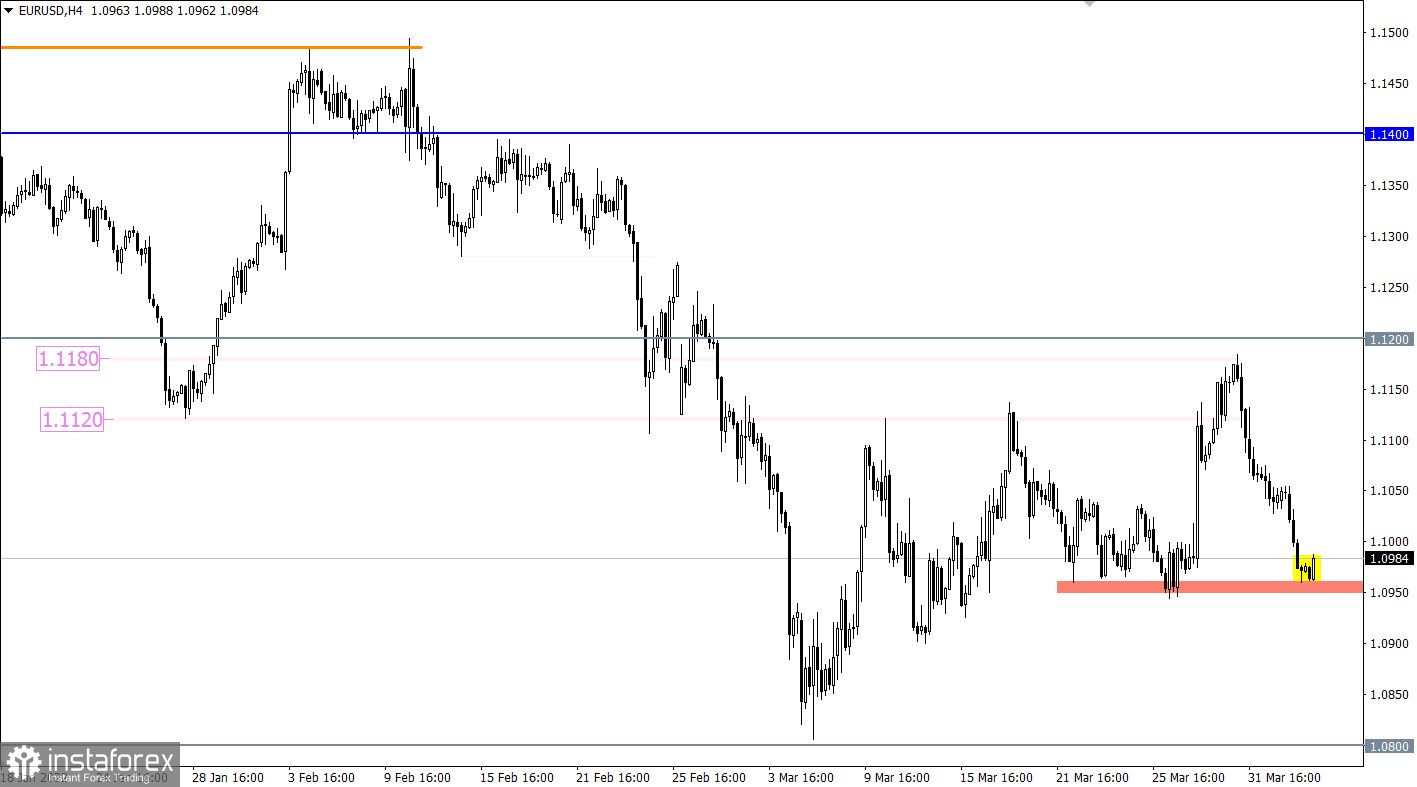
The EURUSD currency pair managed to partially restore dollar positions during the price rebound from the resistance range level of 1.1120/1.1180. This movement returned the quote to the psychologically important area of 1.1000, where there was a slight stagnation.
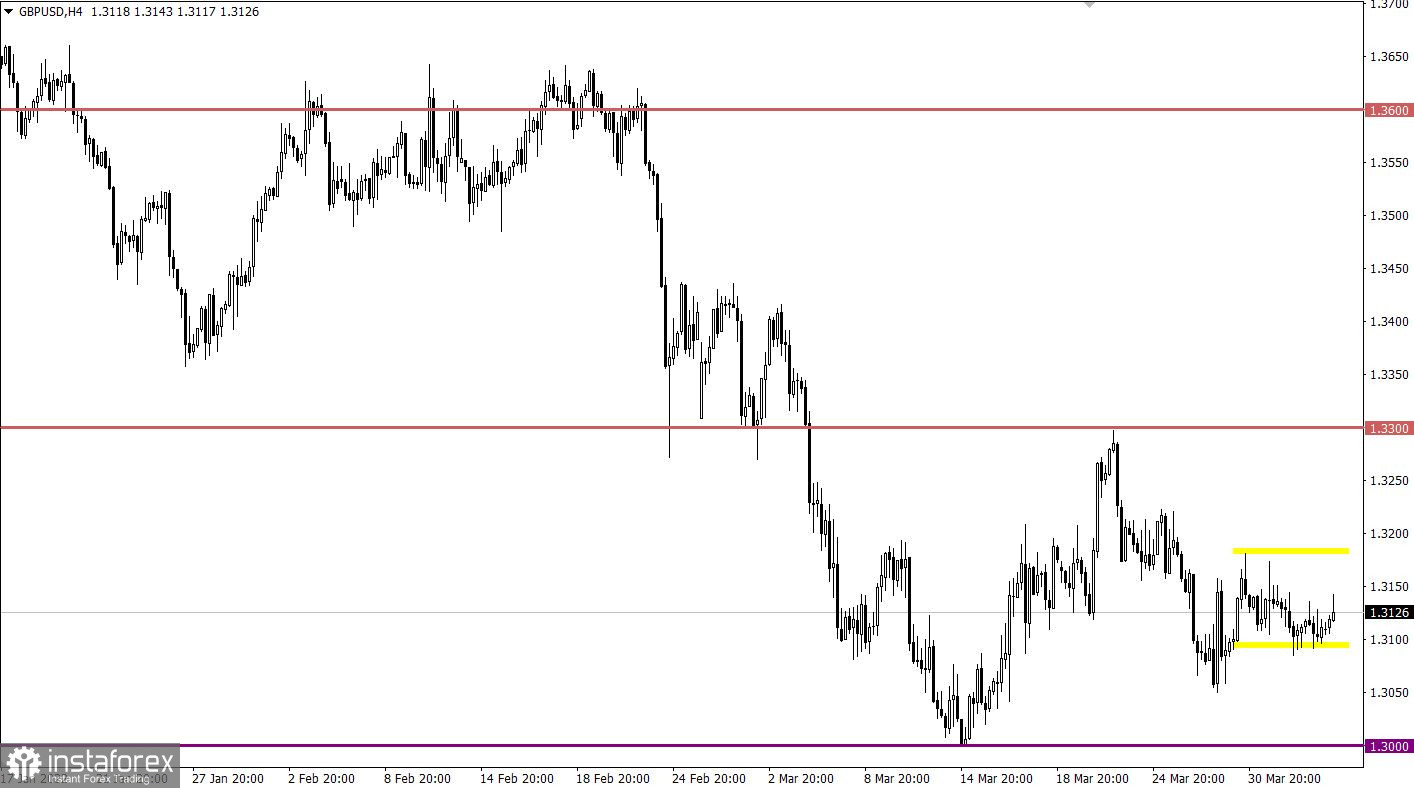
The GBPUSD currency pair is moving in a closed amplitude of 1.3105/1.3180 for the fifth day in a row, showing low activity. This indicates the indecision of traders and the process of accumulation of trading forces. At the same time, when comparing EURUSD and GBPUSD pairs, there is a discrepancy, which should not be due to the positive correlation. This once again proves the fact of the characteristic uncertainty among traders.

Final data on business activity in Europe, Britain, and the United States are expected today, where no drastic changes are expected. The market reaction is highly likely to be moderate, since the indicators are already taken into account in the quotes.
Time targeting
EU Services PMI (Mar) - 08:00 UTC
UK Services PMI (Mar) - 08:30 UTC
US Services PMI (Mar) - 13:45 UTC
At the moment, the market is experiencing a reduction in the volume of short positions due to the variable pivot point in the area of 1.0940/1.0965. This step may lead to a local pullback towards the previously passed level of 1.1000. A subsequent downward move is expected in the market after the price holds below the value of 1.0940 in a four-hour period.
In this situation, trading tactics still consider the method of breaking through one or another border of the established flat. In this regard, buy positions will be valid after the price holds above 1.3185 in a four-hour period, and sell positions will arise after the price holds below 1.3100 in a four-hour period.
A candlestick chart view is graphical rectangles of white and black light, with sticks on top and bottom. When analyzing each candle in detail, you will see its characteristics of a relative period: the opening price, closing price, and maximum and minimum prices.
Horizontal levels are price coordinates, relative to which a stop or a price reversal may occur. These levels are called support and resistance in the market.
Circles and rectangles are highlighted examples where the price of the story unfolded. This color selection indicates horizontal lines that may put pressure on the quote in the future.
The up/down arrows are the reference points of the possible price direction in the future.
*La presente analisi del mercato ha un carattere esclusivamente informativo e non rappresenta una guida per l`effettuazione di una transazione.
Le recensioni analitiche di InstaSpot ti renderanno pienamente consapevole delle tendenze del mercato! Essendo un cliente InstaSpot, ti viene fornito un gran numero di servizi gratuiti per il trading efficiente.


