


Đội ngũ của chúng tôi có hơn 7,000,000 thương nhân!
Hàng ngày chúng tôi làm việc cùng nhau để cải thiện việc giao dịch. Chúng tôi nhận được kết quả cao và luôn tiến lên phía trước.
Sự công nhận của hàng triệu thương nhân trên toàn thế giới là sự đánh giá tốt nhất cho công việc của chúng tôi! Bạn đã đưa ra quyết định của mình và chúng tôi sẽ làm mọi thứ cần thiết để đáp ứng mong đợi của bạn!
Chúng ta cùng với nhau sẽ là một nhóm tuyệt vời!
InstaSpot. Tự hào làm việc cho bạn!


Diễn viên, nhà vô địch mùa giải UFC 6 và là người hùng thật sự!
Người tự mình làm nên tất cả. Người đàn ông đáng kể học hỏi.
Bí mật đằng sau thành công của Taktarov là sự cố gắng liên tục hướng tới mục tiêu.
Hãy khai phá tất cả các mặt tài năng của bạn!
Khám phá, thử, thất bại - nhưng không bao giờ dừng lại!
InstaSpot. Câu chuyện thành công của bạn bắt đầu từ đây!
Monday was traditionally accompanied by an empty macroeconomic calendar.
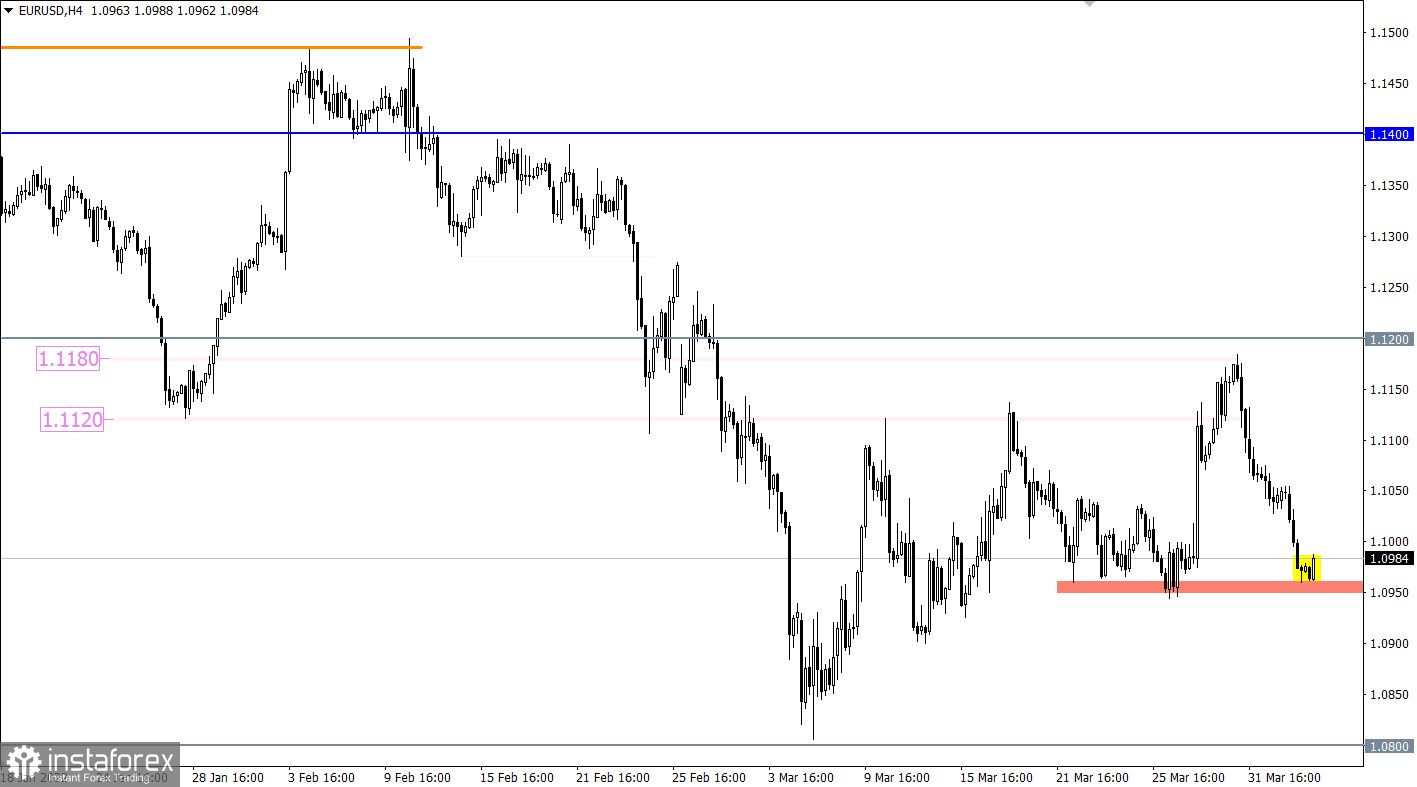
The EURUSD currency pair managed to partially restore dollar positions during the price rebound from the resistance range level of 1.1120/1.1180. This movement returned the quote to the psychologically important area of 1.1000, where there was a slight stagnation.
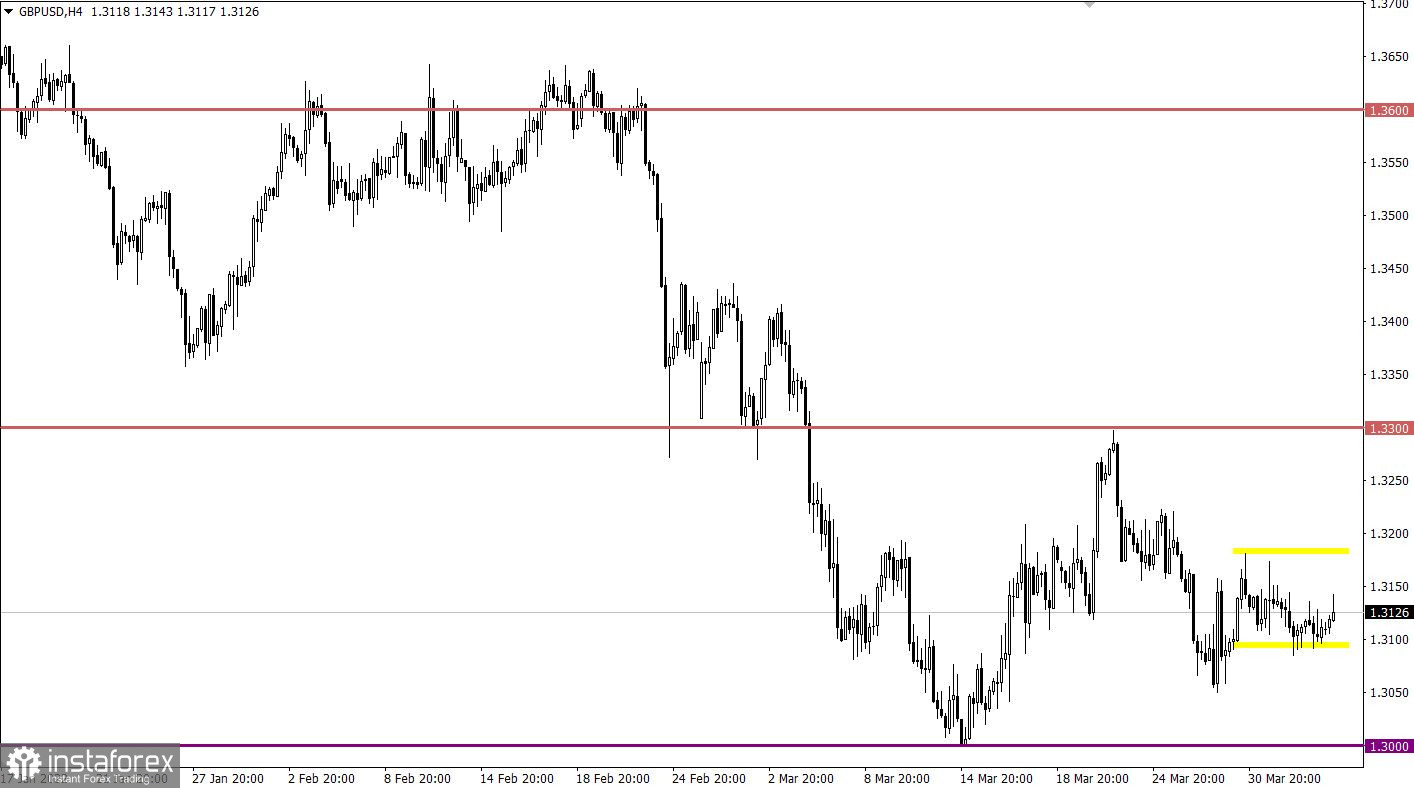
The GBPUSD currency pair is moving in a closed amplitude of 1.3105/1.3180 for the fifth day in a row, showing low activity. This indicates the indecision of traders and the process of accumulation of trading forces. At the same time, when comparing EURUSD and GBPUSD pairs, there is a discrepancy, which should not be due to the positive correlation. This once again proves the fact of the characteristic uncertainty among traders.

Final data on business activity in Europe, Britain, and the United States are expected today, where no drastic changes are expected. The market reaction is highly likely to be moderate, since the indicators are already taken into account in the quotes.
Time targeting
EU Services PMI (Mar) - 08:00 UTC
UK Services PMI (Mar) - 08:30 UTC
US Services PMI (Mar) - 13:45 UTC
At the moment, the market is experiencing a reduction in the volume of short positions due to the variable pivot point in the area of 1.0940/1.0965. This step may lead to a local pullback towards the previously passed level of 1.1000. A subsequent downward move is expected in the market after the price holds below the value of 1.0940 in a four-hour period.
In this situation, trading tactics still consider the method of breaking through one or another border of the established flat. In this regard, buy positions will be valid after the price holds above 1.3185 in a four-hour period, and sell positions will arise after the price holds below 1.3100 in a four-hour period.
A candlestick chart view is graphical rectangles of white and black light, with sticks on top and bottom. When analyzing each candle in detail, you will see its characteristics of a relative period: the opening price, closing price, and maximum and minimum prices.
Horizontal levels are price coordinates, relative to which a stop or a price reversal may occur. These levels are called support and resistance in the market.
Circles and rectangles are highlighted examples where the price of the story unfolded. This color selection indicates horizontal lines that may put pressure on the quote in the future.
The up/down arrows are the reference points of the possible price direction in the future.
*Phân tích thị trường được đăng tải ở đây có nghĩa là để gia tăng nhận thức của bạn, nhưng không đưa ra các chỉ dẫn để thực hiện một giao dịch.
InstaSpot analytical reviews will make you fully aware of market trends! Being an InstaSpot client, you are provided with a large number of free services for efficient trading.


