


我们的团队有超过700万的操盘手!
我们每天都在一起努力改善交易。我们得到了很高的成绩,并继续前进。
世界各地数以百万计的操盘手的认可是我们工作的最大赞赏! 您做出了您的选择,我们将尽一切努力来满足您的期望!
我们是一个共同的伟大团队!
InstaSpot. 自豪地为您工作!


Monday was traditionally accompanied by an empty macroeconomic calendar.
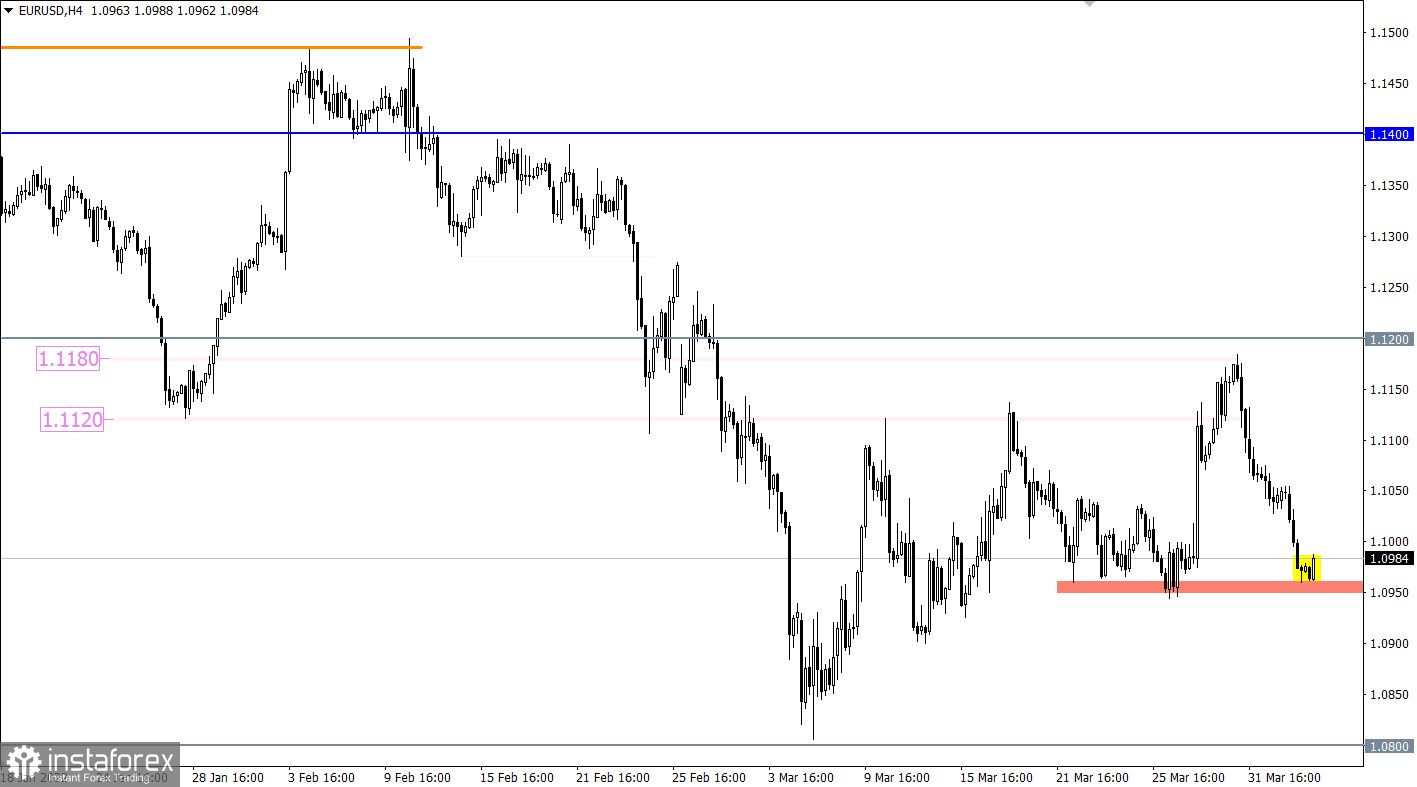
The EURUSD currency pair managed to partially restore dollar positions during the price rebound from the resistance range level of 1.1120/1.1180. This movement returned the quote to the psychologically important area of 1.1000, where there was a slight stagnation.
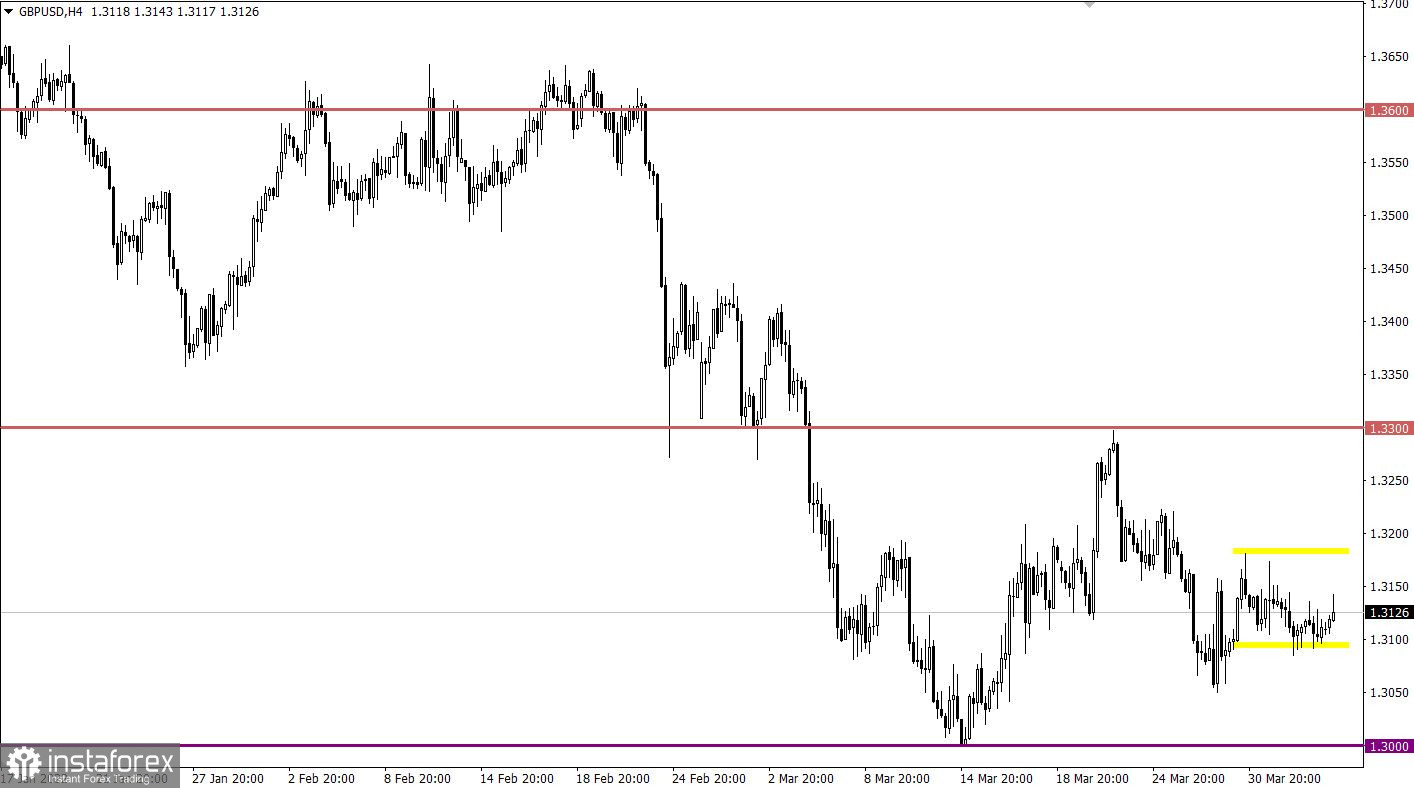
The GBPUSD currency pair is moving in a closed amplitude of 1.3105/1.3180 for the fifth day in a row, showing low activity. This indicates the indecision of traders and the process of accumulation of trading forces. At the same time, when comparing EURUSD and GBPUSD pairs, there is a discrepancy, which should not be due to the positive correlation. This once again proves the fact of the characteristic uncertainty among traders.

Final data on business activity in Europe, Britain, and the United States are expected today, where no drastic changes are expected. The market reaction is highly likely to be moderate, since the indicators are already taken into account in the quotes.
Time targeting
EU Services PMI (Mar) - 08:00 UTC
UK Services PMI (Mar) - 08:30 UTC
US Services PMI (Mar) - 13:45 UTC
At the moment, the market is experiencing a reduction in the volume of short positions due to the variable pivot point in the area of 1.0940/1.0965. This step may lead to a local pullback towards the previously passed level of 1.1000. A subsequent downward move is expected in the market after the price holds below the value of 1.0940 in a four-hour period.
In this situation, trading tactics still consider the method of breaking through one or another border of the established flat. In this regard, buy positions will be valid after the price holds above 1.3185 in a four-hour period, and sell positions will arise after the price holds below 1.3100 in a four-hour period.
A candlestick chart view is graphical rectangles of white and black light, with sticks on top and bottom. When analyzing each candle in detail, you will see its characteristics of a relative period: the opening price, closing price, and maximum and minimum prices.
Horizontal levels are price coordinates, relative to which a stop or a price reversal may occur. These levels are called support and resistance in the market.
Circles and rectangles are highlighted examples where the price of the story unfolded. This color selection indicates horizontal lines that may put pressure on the quote in the future.
The up/down arrows are the reference points of the possible price direction in the future.
*这里的市场分析是为了增加您对市场的了解,而不是给出交易的指示。
InstaSpot分析评论将让您充分了解市场趋势! 作为InstaSpot的客户,您将获得大量的免费服务以实现有效的交易。


