


Il y a maintenant plus de 7 millions de traders dans notre équipe! Chaque jour nous travaillons à améliorer le trading. On s'efforce de vous offrir le meilleur et on obtient les plus beaux succès.
La confiance de millions de traders partout dans le monde est l'évaluation la plus élevée de notre travail!
Vous avez fait votre choix et nous allons faire de notre mieux pour répondre à vos attentes!
Ensemble, nous faisons une super équipe!
InstaSpot est fier de vous servir!


L'acteur, le champion de l'UFC et un vrai bogatyr russe! . Homme qui ne doit sa réussite qu'à lui-même. L'homme qui est sur la même route que nous suivons.
Le secret du succès de Taktarov est le progrès permanent vers la réalisation de son objectif.
Découvrez toutes les facettes de votre talent! Apprenez, essayez, commettez des erreurs, mais ne vous arrêtez pas!
InstaSpot - L'histoire de votre succès commence ici !
Monday was traditionally accompanied by an empty macroeconomic calendar.
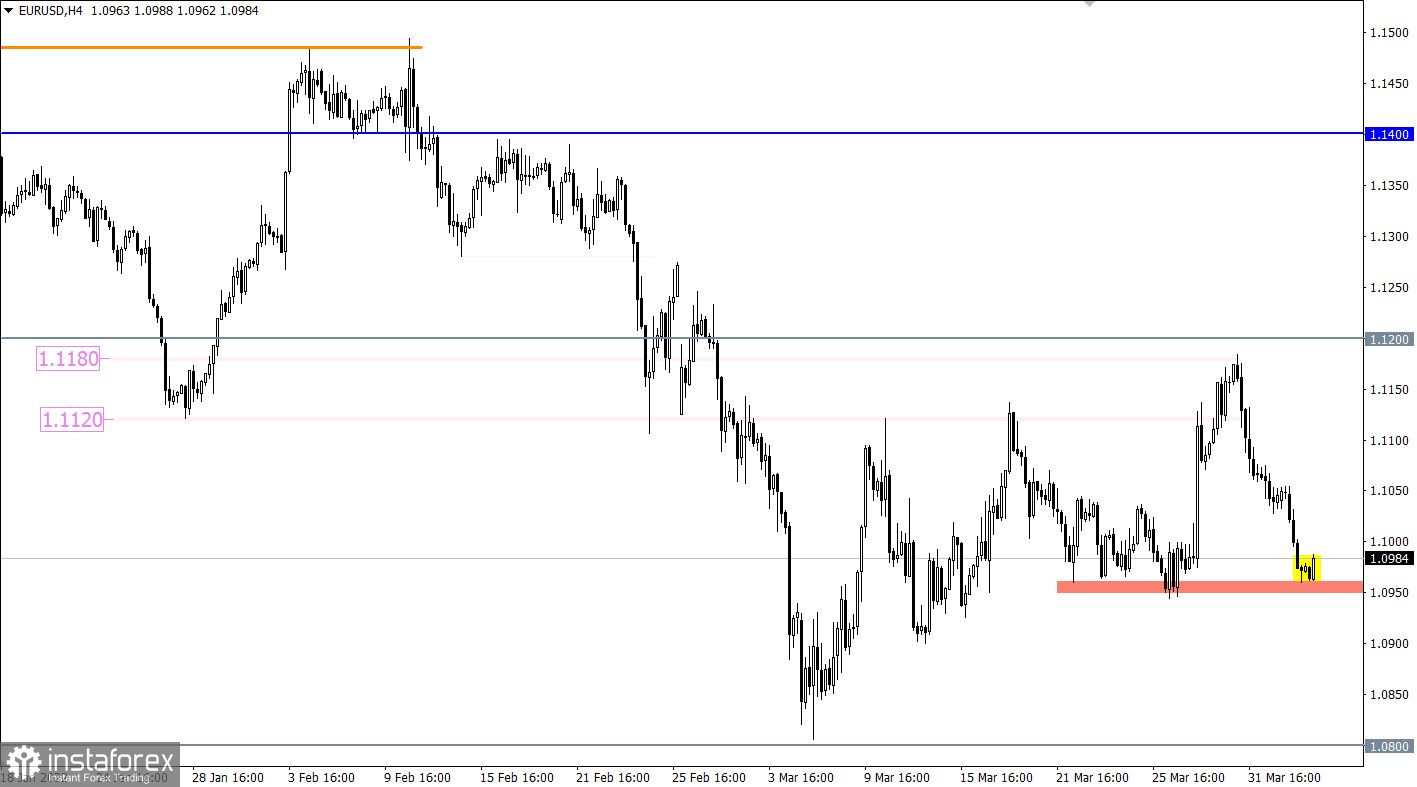
The EURUSD currency pair managed to partially restore dollar positions during the price rebound from the resistance range level of 1.1120/1.1180. This movement returned the quote to the psychologically important area of 1.1000, where there was a slight stagnation.
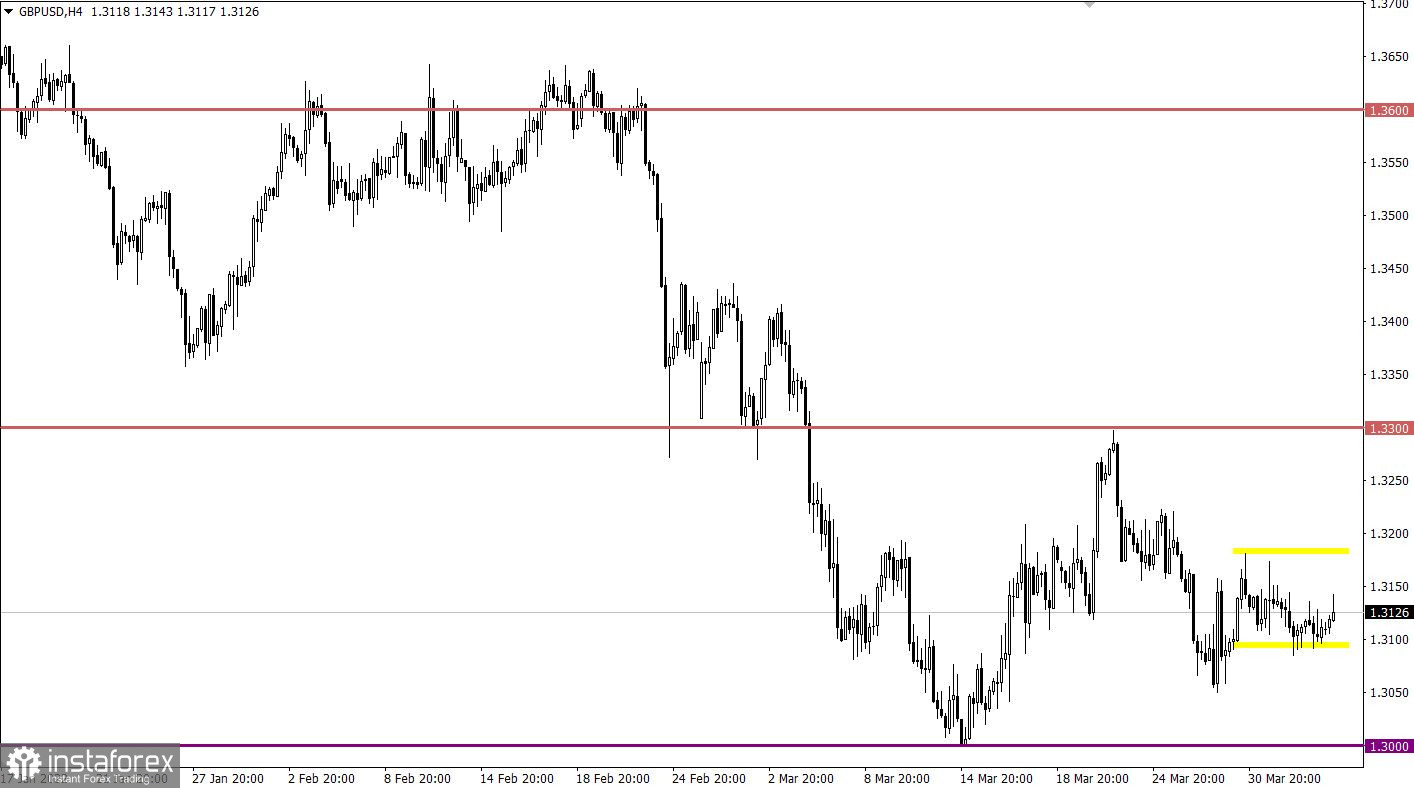
The GBPUSD currency pair is moving in a closed amplitude of 1.3105/1.3180 for the fifth day in a row, showing low activity. This indicates the indecision of traders and the process of accumulation of trading forces. At the same time, when comparing EURUSD and GBPUSD pairs, there is a discrepancy, which should not be due to the positive correlation. This once again proves the fact of the characteristic uncertainty among traders.

Final data on business activity in Europe, Britain, and the United States are expected today, where no drastic changes are expected. The market reaction is highly likely to be moderate, since the indicators are already taken into account in the quotes.
Time targeting
EU Services PMI (Mar) - 08:00 UTC
UK Services PMI (Mar) - 08:30 UTC
US Services PMI (Mar) - 13:45 UTC
At the moment, the market is experiencing a reduction in the volume of short positions due to the variable pivot point in the area of 1.0940/1.0965. This step may lead to a local pullback towards the previously passed level of 1.1000. A subsequent downward move is expected in the market after the price holds below the value of 1.0940 in a four-hour period.
In this situation, trading tactics still consider the method of breaking through one or another border of the established flat. In this regard, buy positions will be valid after the price holds above 1.3185 in a four-hour period, and sell positions will arise after the price holds below 1.3100 in a four-hour period.
A candlestick chart view is graphical rectangles of white and black light, with sticks on top and bottom. When analyzing each candle in detail, you will see its characteristics of a relative period: the opening price, closing price, and maximum and minimum prices.
Horizontal levels are price coordinates, relative to which a stop or a price reversal may occur. These levels are called support and resistance in the market.
Circles and rectangles are highlighted examples where the price of the story unfolded. This color selection indicates horizontal lines that may put pressure on the quote in the future.
The up/down arrows are the reference points of the possible price direction in the future.
*The market analysis posted here is meant to increase your awareness, but not to give instructions to make a trade.
InstaSpot analytical reviews will make you fully aware of market trends! Being an InstaSpot client, you are provided with a large number of free services for efficient trading.


