


Our team has over 7,000,000 traders!
Every day we work together to improve trading. We get high results and move forward.
Recognition by millions of traders all over the world is the best appreciation of our work! You made your choice and we will do everything it takes to meet your expectations!
We are a great team together!
InstaSpot. Proud to work for you!


Actor, UFC 6 tournament champion and a true hero!
The man who made himself. The man that goes our way.
The secret behind Taktarov's success is constant movement towards the goal.
Reveal all the sides of your talent!
Discover, try, fail - but never stop!
InstaSpot. Your success story starts here!

Monday was traditionally accompanied by an empty macroeconomic calendar.
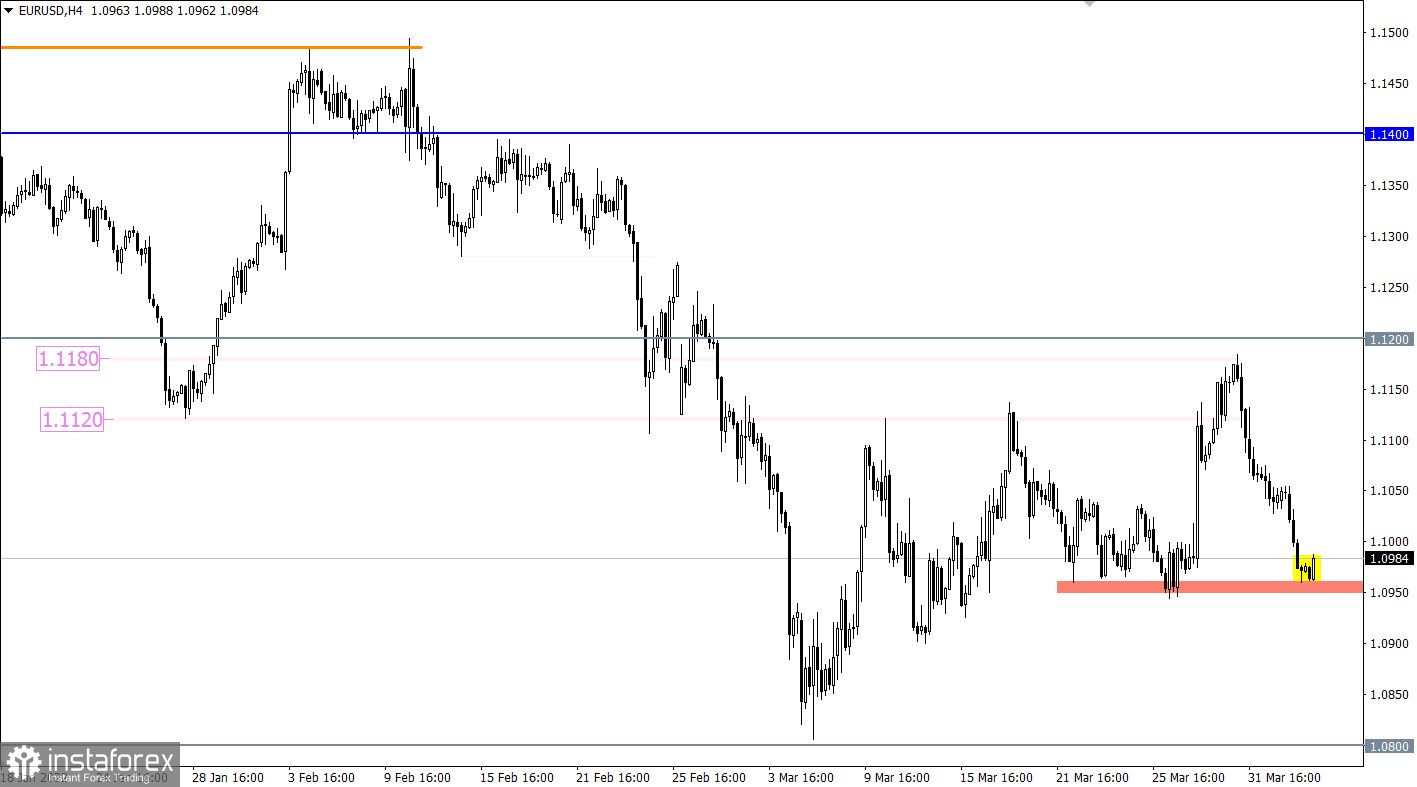
The EURUSD currency pair managed to partially restore dollar positions during the price rebound from the resistance range level of 1.1120/1.1180. This movement returned the quote to the psychologically important area of 1.1000, where there was a slight stagnation.
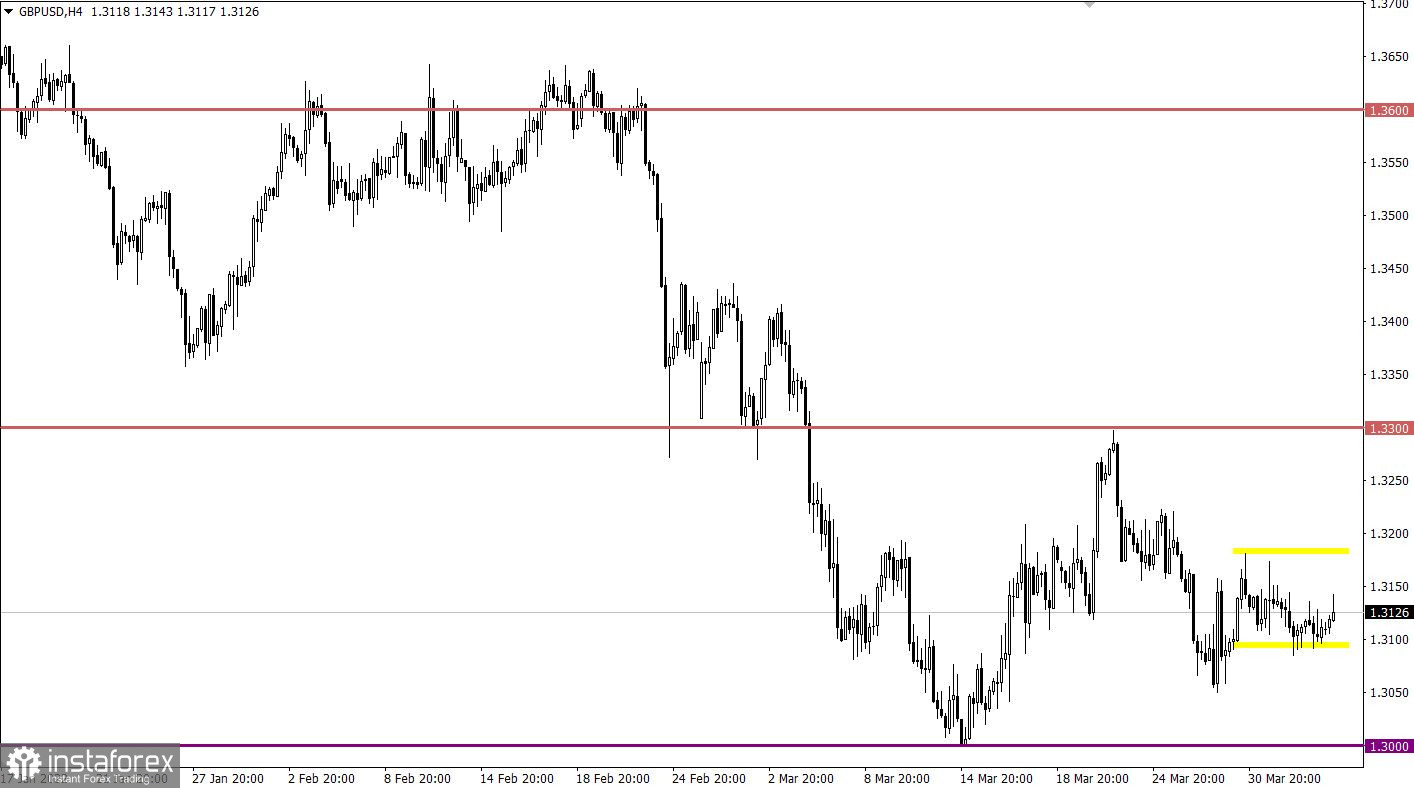
The GBPUSD currency pair is moving in a closed amplitude of 1.3105/1.3180 for the fifth day in a row, showing low activity. This indicates the indecision of traders and the process of accumulation of trading forces. At the same time, when comparing EURUSD and GBPUSD pairs, there is a discrepancy, which should not be due to the positive correlation. This once again proves the fact of the characteristic uncertainty among traders.

Final data on business activity in Europe, Britain, and the United States are expected today, where no drastic changes are expected. The market reaction is highly likely to be moderate, since the indicators are already taken into account in the quotes.
Time targeting
EU Services PMI (Mar) - 08:00 UTC
UK Services PMI (Mar) - 08:30 UTC
US Services PMI (Mar) - 13:45 UTC
At the moment, the market is experiencing a reduction in the volume of short positions due to the variable pivot point in the area of 1.0940/1.0965. This step may lead to a local pullback towards the previously passed level of 1.1000. A subsequent downward move is expected in the market after the price holds below the value of 1.0940 in a four-hour period.
In this situation, trading tactics still consider the method of breaking through one or another border of the established flat. In this regard, buy positions will be valid after the price holds above 1.3185 in a four-hour period, and sell positions will arise after the price holds below 1.3100 in a four-hour period.
A candlestick chart view is graphical rectangles of white and black light, with sticks on top and bottom. When analyzing each candle in detail, you will see its characteristics of a relative period: the opening price, closing price, and maximum and minimum prices.
Horizontal levels are price coordinates, relative to which a stop or a price reversal may occur. These levels are called support and resistance in the market.
Circles and rectangles are highlighted examples where the price of the story unfolded. This color selection indicates horizontal lines that may put pressure on the quote in the future.
The up/down arrows are the reference points of the possible price direction in the future.
*এখানে পোস্ট করা মার্কেট বিশ্লেষণ আপনার সচেতনতা বৃদ্ধির জন্য প্রদান করা হয়, ট্রেড করার নির্দেশনা প্রদানের জন্য প্রদান করা হয় না।
ইন্সটাফরেক্স বিশ্লেষণমূলক পর্যালোচনাগুলো আপনাকে মার্কেট প্রবণতা সম্পর্কে পুরোপুরি সচেতন করবে! ইন্সটাফরেক্সের একজন গ্রাহক হওয়ায়, দক্ষ ট্রেডিং এর জন্য আপনাকে অনেক সেবা বিনামূল্যে প্রদান করা হয়।


