




The legend in the InstaSpot team!
Legend! You think that's bombastic rhetoric? But how should we call a man, who became the first Asian to win the junior world chess championship at 18 and who became the first Indian Grandmaster at 19? That was the start of a hard path to the World Champion title for Viswanathan Anand, the man who became a part of history of chess forever. Now one more legend in the InstaSpot team!





Borussia is one of the most titled football clubs in Germany, which has repeatedly proved to fans: the spirit of competition and leadership will certainly lead to success. Trade in the same way that sports professionals play the game: confidently and actively. Keep a "pass" from Borussia FC and be in the lead with InstaSpot!

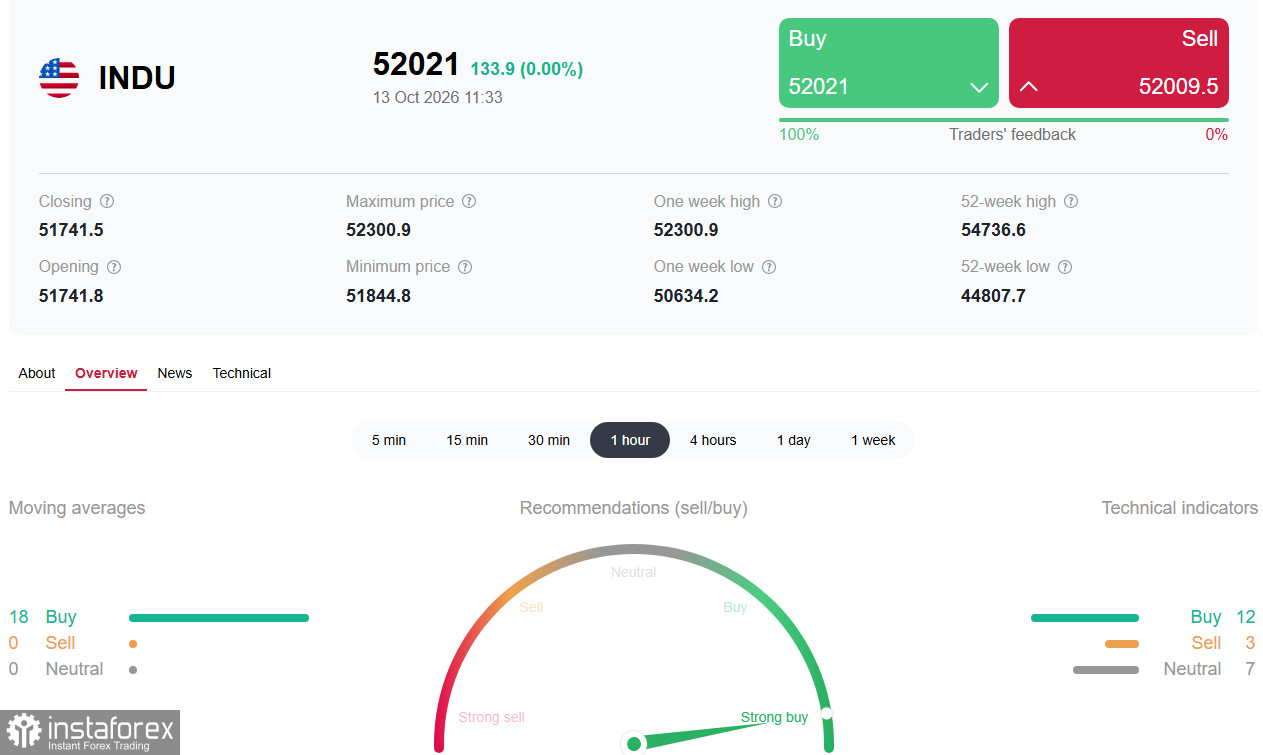
*see also: InstaSpot trading indicators for DJIA (INDU)
The Dow Jones Industrial Average (DJIA) closed Monday up 0.38% at 51,860, showing the greatest resilience among the three major US indices. In Tuesday's European session, futures traded around 52,100.0. While tech names face pressure over AI-related valuation concerns and the Nasdaq is down about 0.44%, the Dow is moving the other way. That divergence is structural, not accidental.
Technology drags, blue chips lift. On Monday, Micron Technology fell by 3.88%, and SK Hynix declined by 4.02%, weighing on the memory sector. Optical names also pulled back: Ciena dropped by nearly 10%, and Lumentum lost about 9.78%. The memory-stock weakness is linked to reports that Chinese ChangXin Memory Technologies has advanced DRAM 4F architecture development, stoking competition concerns.
The Dow's composition proved robust against this wave of selling. Defensive blue chips, including Coca-Cola, Procter & Gamble, and Walmart, showed relative strength. That seesaw effect attracted inflows into the index, while the Nasdaq slid.
Oil's rise is a double-edged sword. Middle East tensions persist. After Houthi strikes on King Khalid Airport in Riyadh, oil prices remain elevated. The energy ETF (XLE) hit a fresh all-time high on Monday, surpassing its September peak. Dow energy names, Exxon Mobil and Chevron, benefit from this. However, higher oil fuels inflationary pressures, thus limiting overall multiple expansion.
Main intrigue of the week — earnings season. JPMorgan, Goldman Sachs, Citigroup, and Wells Fargo report Q3 results on Tuesday. Bank of America and Morgan Stanley follow on Wednesday. FactSet shows that S&P 500 earnings are expected to rise by about 29.6%, marking the fourth consecutive quarter with growth above 25%. JPMorgan believes that corporate profits will provide support to the market.
Brief technical analysis
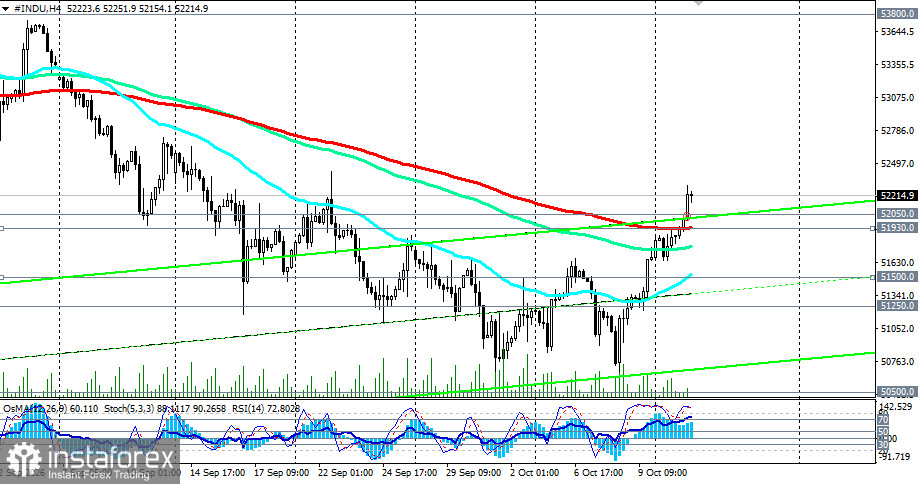
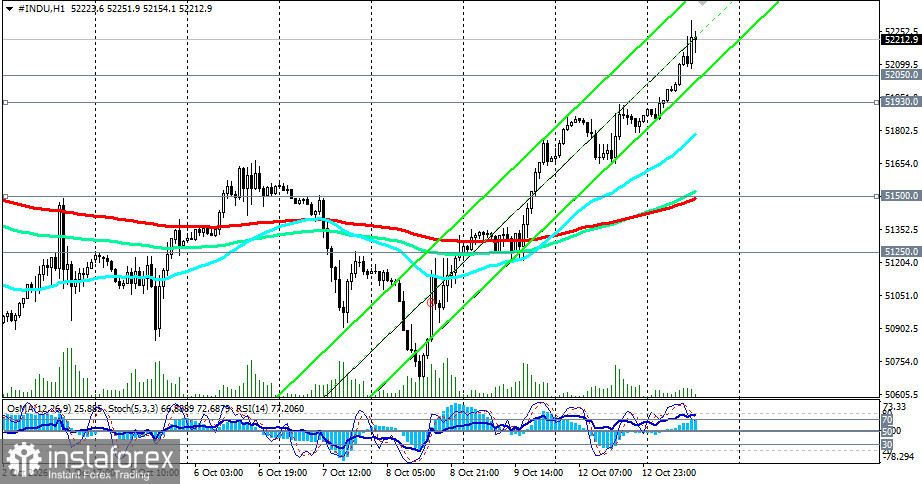
The technical picture remains bullish. The index is trading above key moving averages (the 144- and 200-day EMAs) on the 1- and 4-hour charts, with indicators pointing to a recovery of bullish momentum.
InstaSpot's composite technical analysis (on the 1-hour chart) signals "Strong Buy": 12 of 22 indicators favor buying.
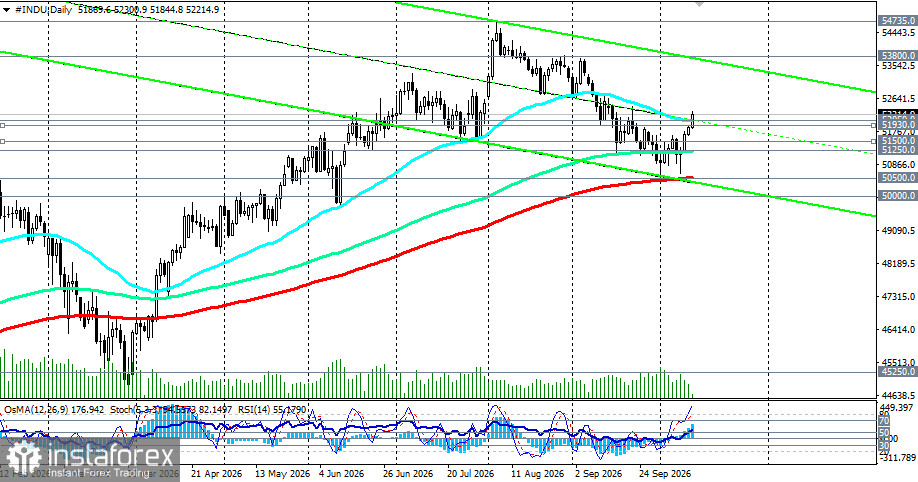
Moving averages are aligned in bullish order, confirming the intact medium-term uptrend. However, the price must still clear an important hurdle: the 50-day EMA on the daily chart (52,050.0) and hold above it.
Wednesday, October 14, 12:30 GMT — US Consumer Price Index (CPI) for September. This is the week's headline macro release. Consensus expects headline CPI to accelerate to 3.7% y/y while core CPI holds around 2.5%. The sharp rise in gasoline prices in September is the main driver of headline inflation, but the core reading is decisive. If core CPI prints above expectations, it could revive bets on an October rate hike and pressure the index.
Tuesday — Pre-market Q3 results from JPMorgan, Goldman Sachs, Citigroup, and Wells Fargo. The banking sector has significant weight in the Dow, so its earnings will directly affect the index.
Wednesday, October 14 — Speeches by Fed officials Christopher Waller, Thomas Barkin, and Susan Collins. Bank of America and Morgan Stanley report results.
Thursday, October 15, 14:30 GMT — US Producer Price Index (PPI) for September.
Friday, October 16, 03:30 GMT — Speech by Fed Chair Kevin Warsh at the IMF/World Bank meetings in Bangkok. His comments will shape market expectations ahead of the December Fed meeting.
The Dow Jones retains relative resilience amid tech weakness. Key level for bulls: 52,300.0; for bears: 51,930.0 (200-EMA on the 4-hour chart).
For short-term traders:
For medium-term investors:
Risk management:
*The market analysis posted here is meant to increase your awareness, but not to give instructions to make a trade.
InstaSpot analytical reviews will make you fully aware of market trends! Being an InstaSpot client, you are provided with a large number of free services for efficient trading.


