


¡Nuestro equipo cuenta con más de 7,000,000 operadores!
Cada día, trabajamos juntos para mejorar las operaciones. Obtenemos grandes resultados y seguimos adelante.
El reconocimiento de millones de operadores en todo el mundo es el mejor agradecimiento a nuestro trabajo! ¡Usted hizo su elección y haremos todo lo que esté a nuestro alcance para satisfacer sus expectativas!
¡Juntos somos un gran equipo!
InstaSpot. ¡Orgulloso de trabajar para usted!


¡Actor, 6 veces ganador del torneo UFC y un verdadero héroe!
El hombre que se hizo a sí mismo. El hombre que sigue nuestro camino.
El secreto detrás del éxito de Taktarov es el constante movimiento hacia el objetivo.
¡Revele todo los lados de su talento!
Descubra, intente, fracase, ¡pero nunca se rinda!
InstaSpot. ¡Su historia de éxito comienza aquí!
Bitcoin still shows no signs of recovery. Moreover, signs of a new decline in "digital gold" are emerging. First, liquidity has been removed from the trend line on the 4-hour timeframe. Second, the bulls are currently so weak that after two deviations, they have not been able to reach the upper boundary of the flat even once. The flat has been ongoing for three weeks, but the price is slowly sliding further down. Thus, the odds of a new decline in "digital gold" are significantly higher than for an increase. Any substantial growth in the first cryptocurrency can be discussed only after the quotes move out of the sideways channel through the upper boundary.
In the meantime, analyst and investor Samson Mow has predicted a new rise in Bitcoin. He justified his forecast by citing Bitcoin's undervaluation relative to gold. According to Mow, Bitcoin is trading approximately 25-65% below its historical trend, closely tied to the market capitalization of gold and the volume of the global money supply. At the same time, Mow believes that gold is overvalued. It should be noted that in 2020 and 2022, this method of analysis indeed predicted significant growth for Bitcoin, but we want to remind that most similar methods correspond to the parable of the Texas sharpshooter. In simple terms, an analysis type, metric, or pattern is selected that has made accurate predictions based on historical data, and new forecasts are generated from that. However, the profitability of a strategy in the past does not guarantee its profitability in the future.
However, not everyone agrees with Mow. Many traders expect further declines in the first cryptocurrency, and we would like to remind you that there are no signs of a near-term recovery on either the 4-hour or daily timeframes.
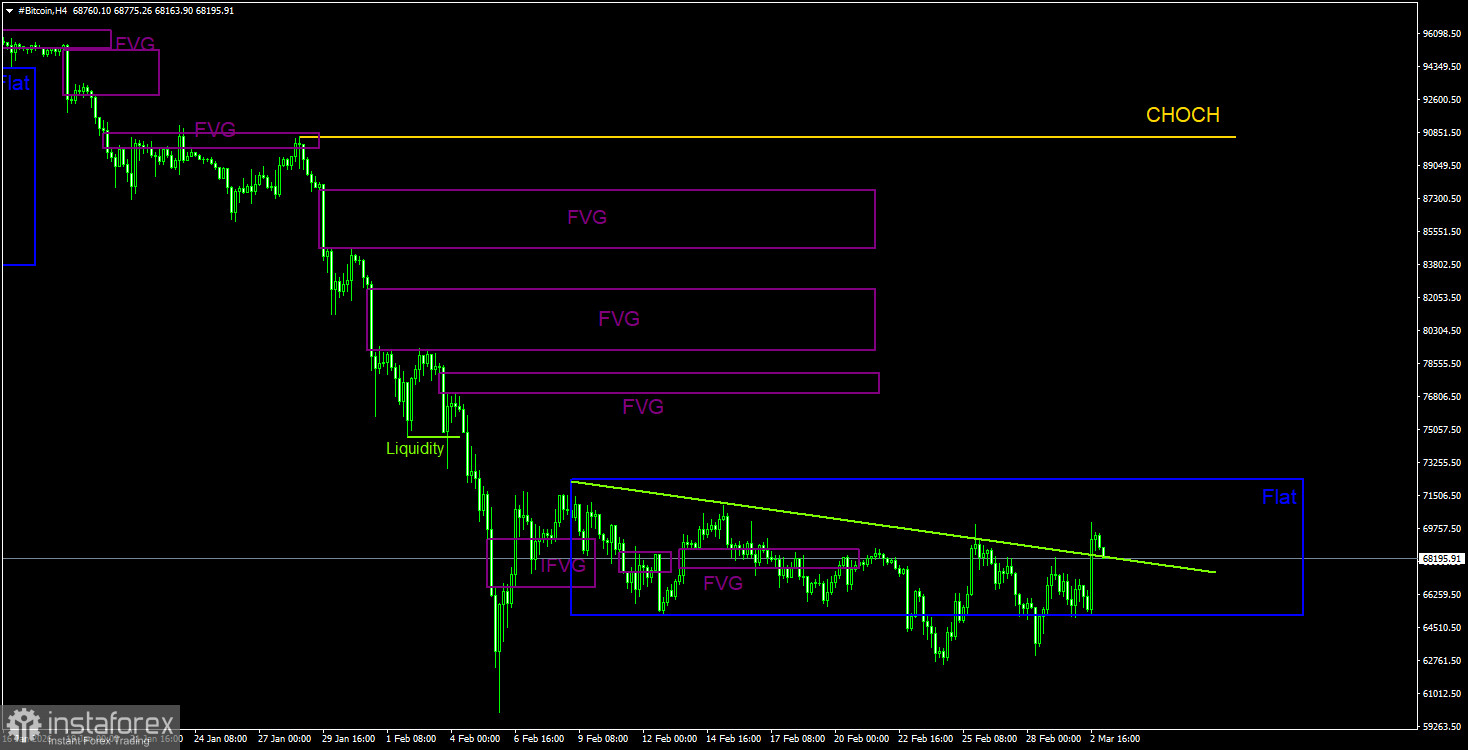
Bitcoin continues to form a full-blown bearish trend. We continue to expect a decline, targeting $57,500 (the 61.8% Fibonacci level of the three-year upward trend), and there are currently no signs of a trend reversal. But even the $57,500 level no longer looks like a final stop. Among the current points of interest (POI), we can note only the nearest bearish FVG on the daily timeframe, which is located quite far from the price. We would also pay attention to the deviations at the upper boundary of the sideways channel on the 4-hour timeframe, as the trend remains bearish.
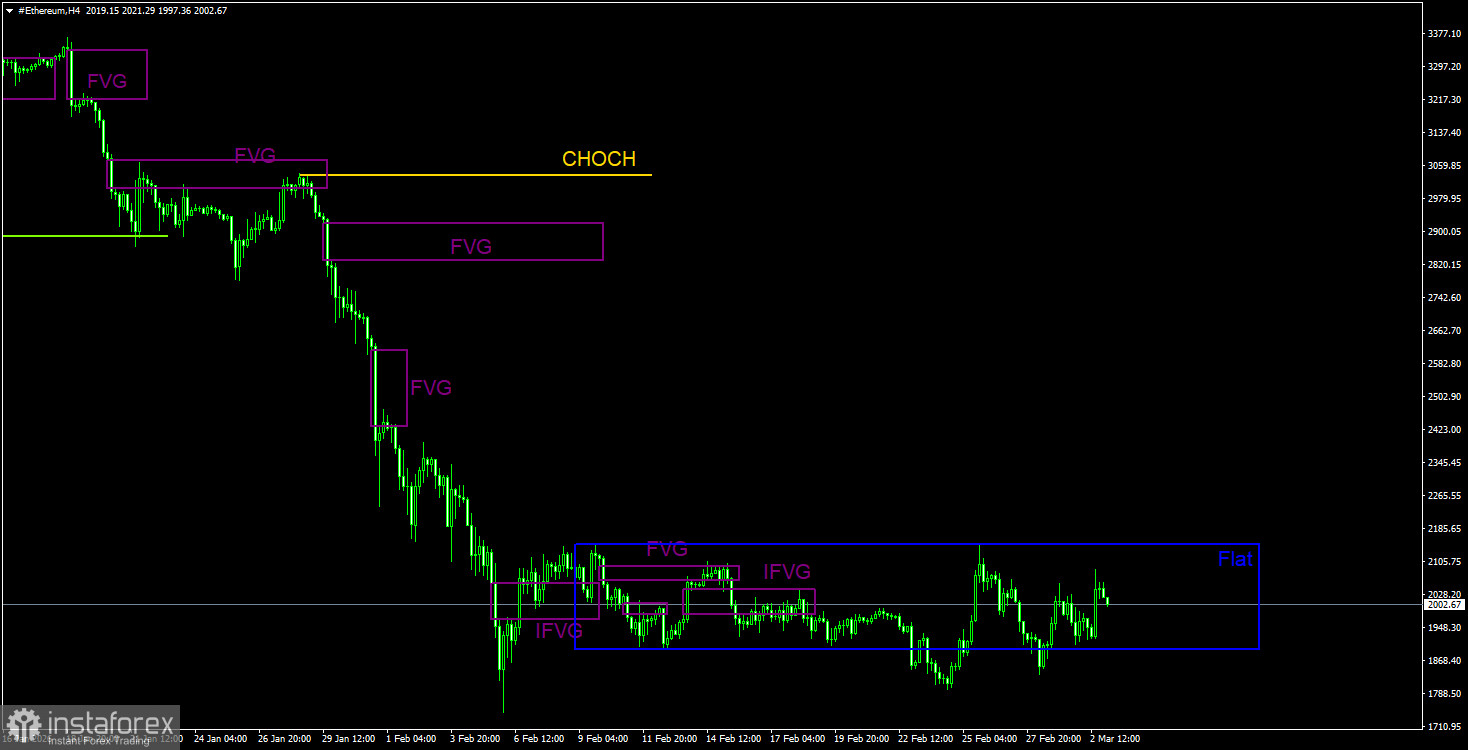
The daily timeframe continues to show a descending trend. The key pattern for sales has been and remains a bearish order block on the weekly timeframe. As we warned, the movement triggered by this signal can be strong and prolonged. After its formation, Ethereum has already dropped by 55% or $2,500. In the near future, an upward correction is expected, but the price is still within a fairly narrow sideways channel. Trading within the flat is advisable only from its boundaries. It is also important to keep in mind Bitcoin's strong influence on the entire cryptocurrency market. There may not be any bearish patterns or signals for Ethereum, but they may be present for Bitcoin.
CHOCH – break of the trend structure.
Liquidity – The liquidity and stop losses of traders that market makers use to build their positions.
FVG – Area of price inefficiency. The price moves very quickly through such areas, indicating a complete absence of one side in the market. Subsequently, the price tends to return and react to such areas.
IFVG – Inverted area of price inefficiency. After returning to such an area, the price receives no reaction and breaks through impulsively, then tests it from the other side.
OB – Order block. The candlestick on which the market maker opened a position to collect liquidity for forming their own position in the opposite direction.
*El análisis de mercado publicado aquí tiene la finalidad de incrementar su conocimiento, más no darle instrucciones para realizar una operación.
¡Los informes analíticos de InstaSpot lo mantendrá bien informado de las tendencias del mercado! Al ser un cliente de InstaSpot, se le proporciona una gran cantidad de servicios gratuitos para una operación eficiente.


