




¡La leyenda en el equipo de InstaSpot!
¡Leyenda! ¿Cree que es una retórica grandilocuente? Pero, ¿cómo deberíamos llamar a un hombre, que se convirtió en el primer asiático en ganar el campeonato mundial de ajedrez júnior a los 18 años y en el primer Gran Maestro indio a los 19 años? Ese fue el comienzo de un camino difícil hacia el título de Campeón del Mundo para Viswanathan Anand, el hombre que se convirtió en parte de la historia del ajedrez para siempre. ¡Ahora una leyenda más en el equipo de InstaSpot!





Borussia es uno de los clubes de fútbol con más títulos en Alemania, que ha demostrado repetidamente a los fanáticos: el espíritu de competencia y liderazgo que ciertamente conducirán al éxito. Opere de la misma manera que los profesionales del deporte: con confianza y de forma activa. ¡Mantenga un "pase" del Borussia FC y lidere con InstaSpot!
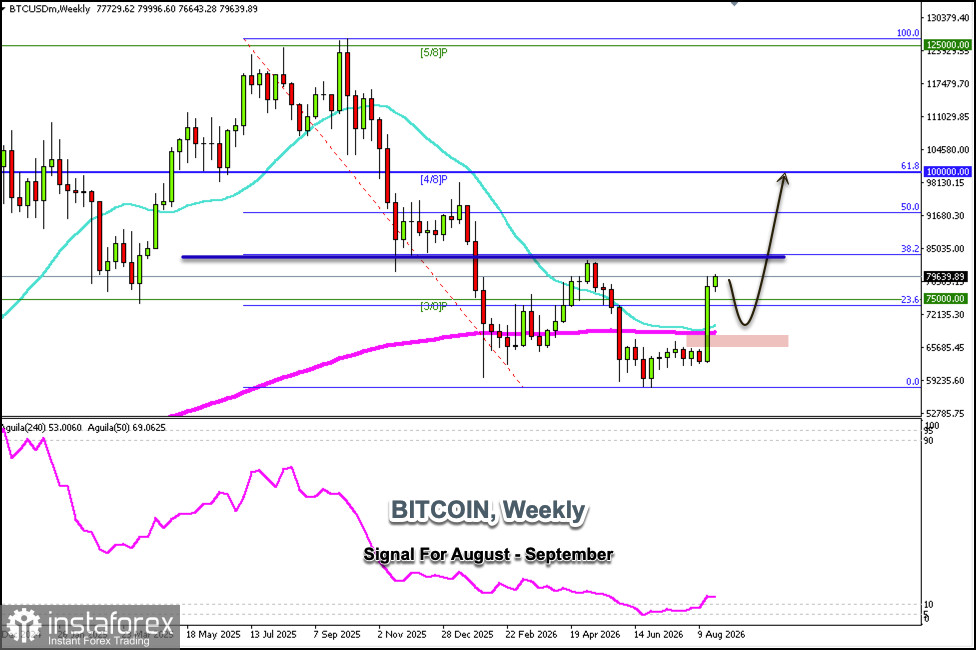
The weekly Bitcoin chart shows a strong uptrend, and it is likely to continue rising in the coming days until it reaches the 38.2% Fibonacci retracement level around $85,000.
On the daily chart, Bitcoin faces strong resistance around $81,250—a level representing the +2/8 Murray level—and is also technically overbought. Therefore, if the price reaches this level in the coming hours, it could be considered a signal to sell below this zone.
If the upward momentum prevails and Bitcoin breaks above $81,250, it is likely to continue rising until it reaches April's high around $85,000.
Our outlook remains bullish, but we must be very cautious, as a technical correction is expected below $81,250 in the coming weeks. If Bitcoin remains below this level, we can sell with targets at the 3/8 Murray level around $75,000 and ultimately expect it to reach the 200 EMA, which coincides with the 21 SMA around $66,500.
Bitcoin is expected to hover between $81,250 and $75,000 over the next few days; this will be a good range for buying and selling while awaiting consolidation.
*El análisis de mercado publicado aquí tiene la finalidad de incrementar su conocimiento, más no darle instrucciones para realizar una operación.
¡Los informes analíticos de InstaSpot lo mantendrá bien informado de las tendencias del mercado! Al ser un cliente de InstaSpot, se le proporciona una gran cantidad de servicios gratuitos para una operación eficiente.


