




انسٹا فاریکس ٹیم میں لیجنڈ!
لیجنڈ!آپ کو لگتا ہے کہ یہ حیرت انگیز بیانات ہے؟ لیکن ہمیں ایسے شخص کو کیا کہنا چاہئے ، جو 18 سال میں جونیئر ورلڈ شطرنج چیمپئن شپ جیتنے والا پہلا ایشین بن گیا تھا اور 19 میں پہلا ہندوستانی گرینڈ ماسٹر بنا؟ ورلڈ چیمپیئن ٹائٹل کے لئے یہ مشکل آغاز تھا جو وشونااتھ آنند کے لئے تھا ، وہ شخص جو ہمیشہ کے لئے شطرنج کی تاریخ کا حصہ بن گیا تھا۔ انسٹا فاریکس ٹیم میں اب ایک اور لیجنڈ!





Borussia is one of the most titled football clubs in Germany, which has repeatedly proved to fans: the spirit of competition and leadership will certainly lead to success. Trade in the same way that sports professionals play the game: confidently and actively. Keep a "pass" from Borussia FC and be in the lead with InstaSpot!

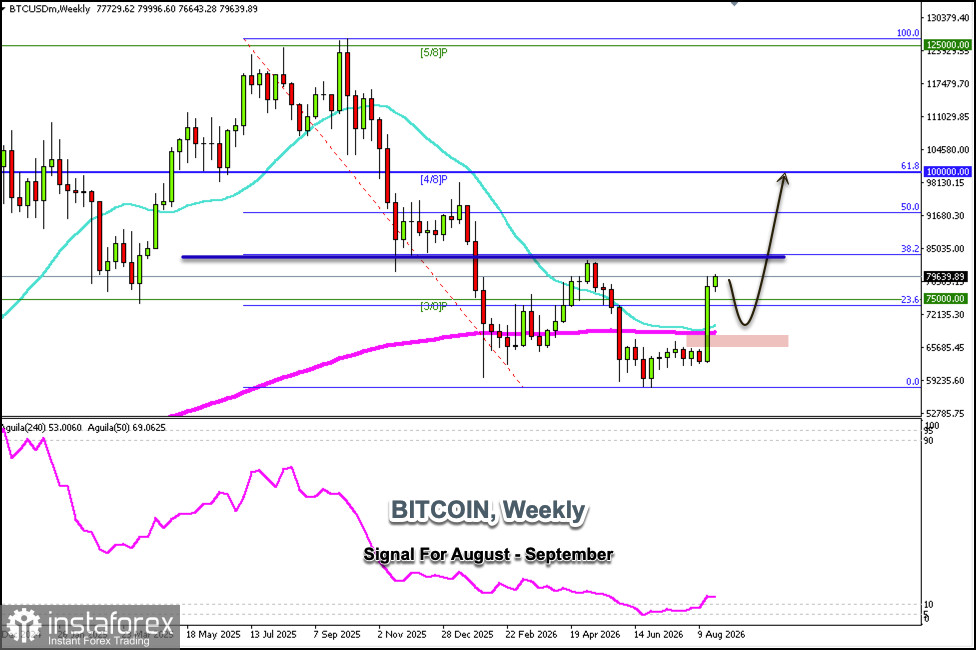
The weekly Bitcoin chart shows a strong uptrend, and it is likely to continue rising in the coming days until it reaches the 38.2% Fibonacci retracement level around $85,000.
On the daily chart, Bitcoin faces strong resistance around $81,250—a level representing the +2/8 Murray level—and is also technically overbought. Therefore, if the price reaches this level in the coming hours, it could be considered a signal to sell below this zone.
If the upward momentum prevails and Bitcoin breaks above $81,250, it is likely to continue rising until it reaches April's high around $85,000.
Our outlook remains bullish, but we must be very cautious, as a technical correction is expected below $81,250 in the coming weeks. If Bitcoin remains below this level, we can sell with targets at the 3/8 Murray level around $75,000 and ultimately expect it to reach the 200 EMA, which coincides with the 21 SMA around $66,500.
Bitcoin is expected to hover between $81,250 and $75,000 over the next few days; this will be a good range for buying and selling while awaiting consolidation.
*تعینات کیا مراد ہے مارکیٹ کے تجزیات یہاں ارسال کیے جاتے ہیں جس کا مقصد آپ کی بیداری بڑھانا ہے، لیکن تجارت کرنے کے لئے ہدایات دینا نہیں.
InstaSpot analytical reviews will make you fully aware of market trends! Being an InstaSpot client, you are provided with a large number of free services for efficient trading.


