




Our team has over 7,000,000 traders!
Every day we work together to improve trading. We get high results and move forward.
Recognition by millions of traders all over the world is the best appreciation of our work! You made your choice and we will do everything it takes to meet your expectations!
We are a great team together!
InstaSpot. Proud to work for you!





Actor, UFC 6 tournament champion and a true hero!
The man who made himself. The man that goes our way.
The secret behind Taktarov's success is constant movement towards the goal.
Reveal all the sides of your talent!
Discover, try, fail - but never stop!
InstaSpot. Your success story starts here!

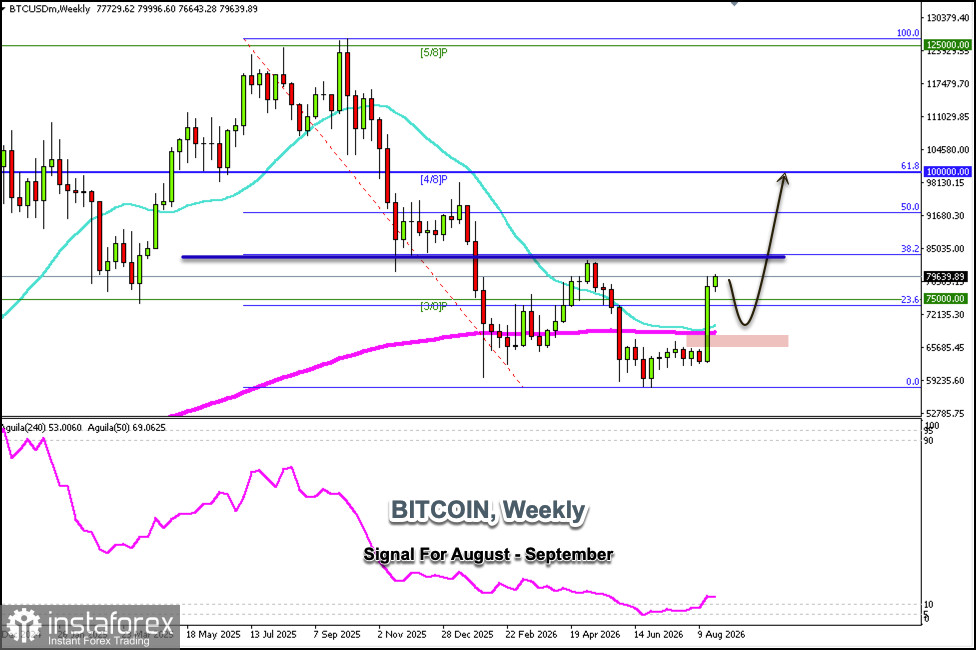
The weekly Bitcoin chart shows a strong uptrend, and it is likely to continue rising in the coming days until it reaches the 38.2% Fibonacci retracement level around $85,000.
On the daily chart, Bitcoin faces strong resistance around $81,250—a level representing the +2/8 Murray level—and is also technically overbought. Therefore, if the price reaches this level in the coming hours, it could be considered a signal to sell below this zone.
If the upward momentum prevails and Bitcoin breaks above $81,250, it is likely to continue rising until it reaches April's high around $85,000.
Our outlook remains bullish, but we must be very cautious, as a technical correction is expected below $81,250 in the coming weeks. If Bitcoin remains below this level, we can sell with targets at the 3/8 Murray level around $75,000 and ultimately expect it to reach the 200 EMA, which coincides with the 21 SMA around $66,500.
Bitcoin is expected to hover between $81,250 and $75,000 over the next few days; this will be a good range for buying and selling while awaiting consolidation.
*এখানে পোস্ট করা মার্কেট বিশ্লেষণ আপনার সচেতনতা বৃদ্ধির জন্য প্রদান করা হয়, ট্রেড করার নির্দেশনা প্রদানের জন্য প্রদান করা হয় না।
ইন্সটাফরেক্স বিশ্লেষণমূলক পর্যালোচনাগুলো আপনাকে মার্কেট প্রবণতা সম্পর্কে পুরোপুরি সচেতন করবে! ইন্সটাফরেক্সের একজন গ্রাহক হওয়ায়, দক্ষ ট্রেডিং এর জন্য আপনাকে অনেক সেবা বিনামূল্যে প্রদান করা হয়।


