


¡Nuestro equipo cuenta con más de 7,000,000 operadores!
Cada día, trabajamos juntos para mejorar las operaciones. Obtenemos grandes resultados y seguimos adelante.
El reconocimiento de millones de operadores en todo el mundo es el mejor agradecimiento a nuestro trabajo! ¡Usted hizo su elección y haremos todo lo que esté a nuestro alcance para satisfacer sus expectativas!
¡Juntos somos un gran equipo!
InstaSpot. ¡Orgulloso de trabajar para usted!


¡Actor, 6 veces ganador del torneo UFC y un verdadero héroe!
El hombre que se hizo a sí mismo. El hombre que sigue nuestro camino.
El secreto detrás del éxito de Taktarov es el constante movimiento hacia el objetivo.
¡Revele todo los lados de su talento!
Descubra, intente, fracase, ¡pero nunca se rinda!
InstaSpot. ¡Su historia de éxito comienza aquí!
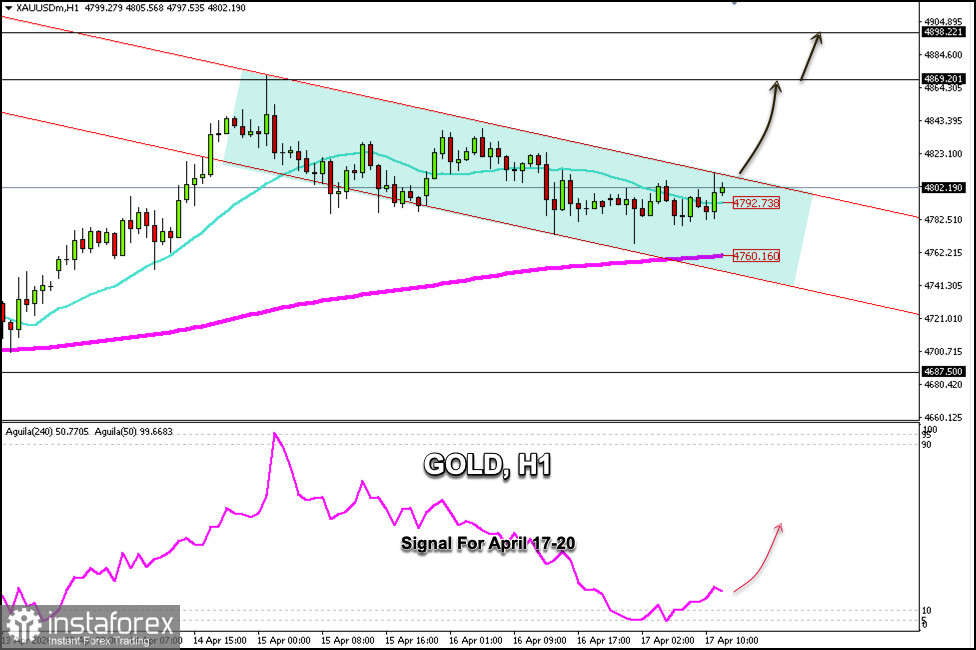
Gold is trading around $4,802 within a bearish trend channel on the H1 chart that has been forming since April 14. The chart shows that gold is consolidating above the 200-period EMA at $4,760, suggesting that gold could see a recovery in the coming days, potentially reaching the R_3 resistance level at $4,898.
Looking at the H1 chart, gold is above the 21SMA and is testing the strong resistance of the downtrend channel. Technically, XAU/USD appears to be forming a bullish pennant pattern on the H4 chart. If the price consolidates above $4,800, we could expect it to reach $4,869 and $4,900 in the coming hours.
Conversely, if gold fails to break above $4,800, we could expect a correction toward the 200 EMA at $4,760, and we could anticipate a technical bounce in this area.
The Eagle indicator is showing a positive signal, hence gold is likely to continue rising in the coming hours. Therefore, we will use this technical analysis to buy above the 21 SMA at $4,792 or above $4,760, as both levels offer a positive outlook for gold in the coming hours.
*El análisis de mercado publicado aquí tiene la finalidad de incrementar su conocimiento, más no darle instrucciones para realizar una operación.
¡Los informes analíticos de InstaSpot lo mantendrá bien informado de las tendencias del mercado! Al ser un cliente de InstaSpot, se le proporciona una gran cantidad de servicios gratuitos para una operación eficiente.


