


Kumpulan kami mempunyai lebih daripada 7,000,000 pedagang!
Setiap hari kami bekerjasama untuk meningkatkan perdagangan. Kami mendapat keputusan yang tinggi dan bergerak ke hadapan.
Pengiktirafan oleh berjuta-juta pedagang di seluruh dunia adalah penghargaan terbaik untuk kerja kami! Anda membuat pilihan anda dan kami akan melakukan segalanya yang diperlukan untuk memenuhi jangkaan anda!
Kami adalah kumpulan yang terbaik bersama!
InstaSpot. Berbangga bekerja untuk anda!


Pelakon, juara kejohanan UFC 6 dan seorang wira sebenar!
Lelaki yang membuat dirinya sendiri. Lelaki yang mengikut cara kami.
Rahsia di sebalik kejayaan Taktarov adalah pergerakan berterusan ke arah matlamat.
Dedahkan semua segi bakat anda!
Cari, cuba, gagal - tetapi tidak pernah berhenti!
InstaSpot. Kisah kejayaan anda bermula di sini!

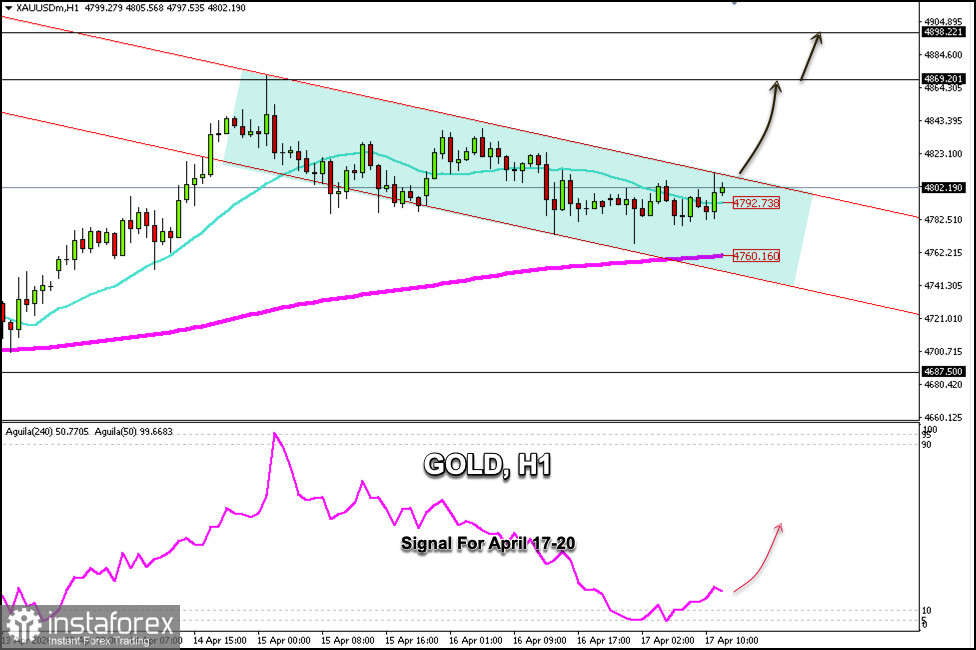
Gold is trading around $4,802 within a bearish trend channel on the H1 chart that has been forming since April 14. The chart shows that gold is consolidating above the 200-period EMA at $4,760, suggesting that gold could see a recovery in the coming days, potentially reaching the R_3 resistance level at $4,898.
Looking at the H1 chart, gold is above the 21SMA and is testing the strong resistance of the downtrend channel. Technically, XAU/USD appears to be forming a bullish pennant pattern on the H4 chart. If the price consolidates above $4,800, we could expect it to reach $4,869 and $4,900 in the coming hours.
Conversely, if gold fails to break above $4,800, we could expect a correction toward the 200 EMA at $4,760, and we could anticipate a technical bounce in this area.
The Eagle indicator is showing a positive signal, hence gold is likely to continue rising in the coming hours. Therefore, we will use this technical analysis to buy above the 21 SMA at $4,792 or above $4,760, as both levels offer a positive outlook for gold in the coming hours.
* Analisis pasaran yang disiarkan di sini adalah bertujuan untuk meningkatkan kesedaran anda, tetapi tidak untuk memberi arahan untuk membuat perdagangan.
Kajian analisis InstaSpot akan membuat anda mengetahui sepenuhnya aliran pasaran! Sebagai pelanggan InstaSpot, anda disediakan sejumlah besar perkhidmatan percuma untuk dagangan yang cekap.


