


Our team has over 7,000,000 traders!
Every day we work together to improve trading. We get high results and move forward.
Recognition by millions of traders all over the world is the best appreciation of our work! You made your choice and we will do everything it takes to meet your expectations!
We are a great team together!
InstaSpot. Proud to work for you!


Actor, UFC 6 tournament champion and a true hero!
The man who made himself. The man that goes our way.
The secret behind Taktarov's success is constant movement towards the goal.
Reveal all the sides of your talent!
Discover, try, fail - but never stop!
InstaSpot. Your success story starts here!

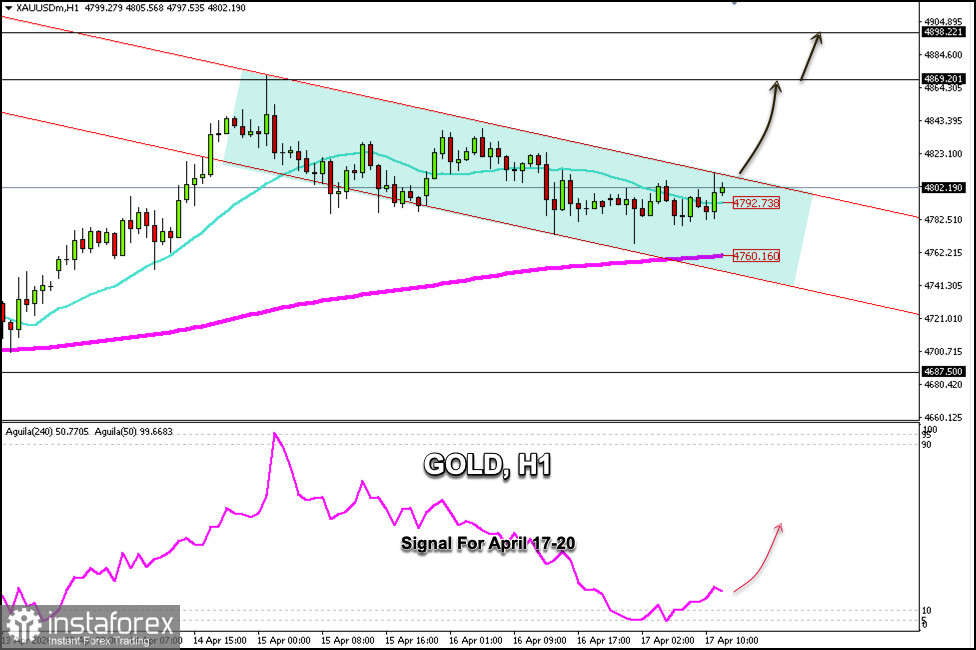
Gold is trading around $4,802 within a bearish trend channel on the H1 chart that has been forming since April 14. The chart shows that gold is consolidating above the 200-period EMA at $4,760, suggesting that gold could see a recovery in the coming days, potentially reaching the R_3 resistance level at $4,898.
Looking at the H1 chart, gold is above the 21SMA and is testing the strong resistance of the downtrend channel. Technically, XAU/USD appears to be forming a bullish pennant pattern on the H4 chart. If the price consolidates above $4,800, we could expect it to reach $4,869 and $4,900 in the coming hours.
Conversely, if gold fails to break above $4,800, we could expect a correction toward the 200 EMA at $4,760, and we could anticipate a technical bounce in this area.
The Eagle indicator is showing a positive signal, hence gold is likely to continue rising in the coming hours. Therefore, we will use this technical analysis to buy above the 21 SMA at $4,792 or above $4,760, as both levels offer a positive outlook for gold in the coming hours.
*The market analysis posted here is meant to increase your awareness, but not to give instructions to make a trade.
InstaSpot analytical reviews will make you fully aware of market trends! Being an InstaSpot client, you are provided with a large number of free services for efficient trading.


