


¡La leyenda en el equipo de InstaSpot!
¡Leyenda! ¿Cree que es una retórica grandilocuente? Pero, ¿cómo deberíamos llamar a un hombre, que se convirtió en el primer asiático en ganar el campeonato mundial de ajedrez júnior a los 18 años y en el primer Gran Maestro indio a los 19 años? Ese fue el comienzo de un camino difícil hacia el título de Campeón del Mundo para Viswanathan Anand, el hombre que se convirtió en parte de la historia del ajedrez para siempre. ¡Ahora una leyenda más en el equipo de InstaSpot!


Borussia es uno de los clubes de fútbol con más títulos en Alemania, que ha demostrado repetidamente a los fanáticos: el espíritu de competencia y liderazgo que ciertamente conducirán al éxito. Opere de la misma manera que los profesionales del deporte: con confianza y de forma activa. ¡Mantenga un "pase" del Borussia FC y lidere con InstaSpot!
The wave structure on the 4-hour chart for the S&P 500 (#SPX) appears somewhat ambiguous, but overall, the pattern is clear. Looking at the 24-hour chart, the primary takeaway is the presence of a long-term five-wave structure that extends far beyond the visible terminal window at minimum scale. In simpler terms, U.S. stock indices have been in an uptrend for an extended period. As we know, trends alternate, and it appears that wave 5 in 5 has now completed.
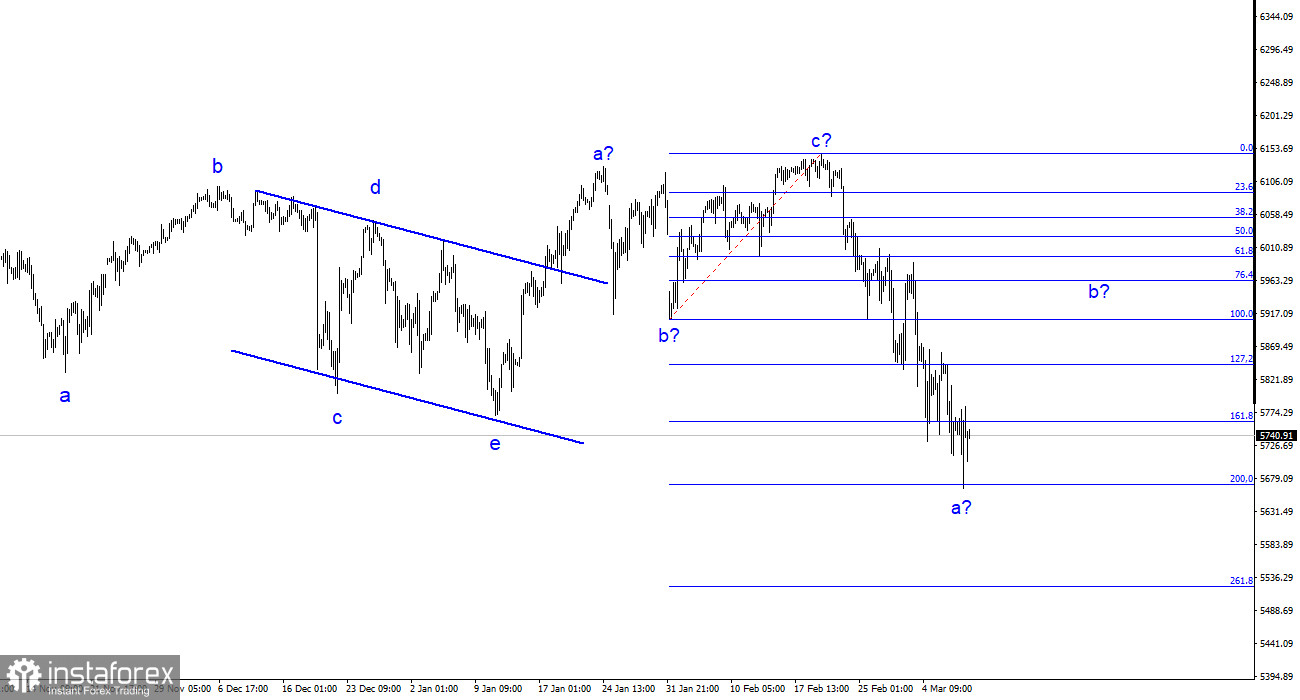
The S&P 500 attempted to break above the 6,093 level four times, aligning with the 200.0% Fibonacci extension from wave 4, but failed on each occasion. Given these developments, a corrective wave cycle is likely on the horizon. The U.S. stock market is overheated, and an increasing number of experts are discussing the possibility of a bubble.
Shifting to the 4-hour chart, a completed a-b-c-d-e complex corrective structure is visible, followed by an upward a-b-c formation. Consequently, a new bearish wave structure appears to be forming, with the first wave resembling an impulse wave. Based on this, I anticipate a short-term upward wave (wave 2 or b), after which a renewed downtrend is expected. Another upward impulse may occur, but this could be followed by a more significant decline in the index. My current approach is to focus on the daily chart's structure, which suggests a prolonged downturn in the S&P 500.
The S&P 500 failed to sustain its uptrend, lacking both technical wave-based and fundamental justifications. In recent weeks, U.S. stock indices have been consistently declining, not only due to the policies of the new U.S. president but also because the countries targeted by Trump's tariffs are preparing retaliatory measures. As a result, American manufacturers will also face restrictions, leading to lower sales, reduced revenue, and weaker profitability. What should investors do in this situation?
Another critical factor is the growing global movement away from U.S. goods due to Trump's protectionist policies. This suggests that even without additional tariffs on American exports, demand for U.S. products is already declining. Trump has achieved something remarkable—he has incentivized half the world to reject American goods. This naturally raises the question: What does this mean for U.S. companies?
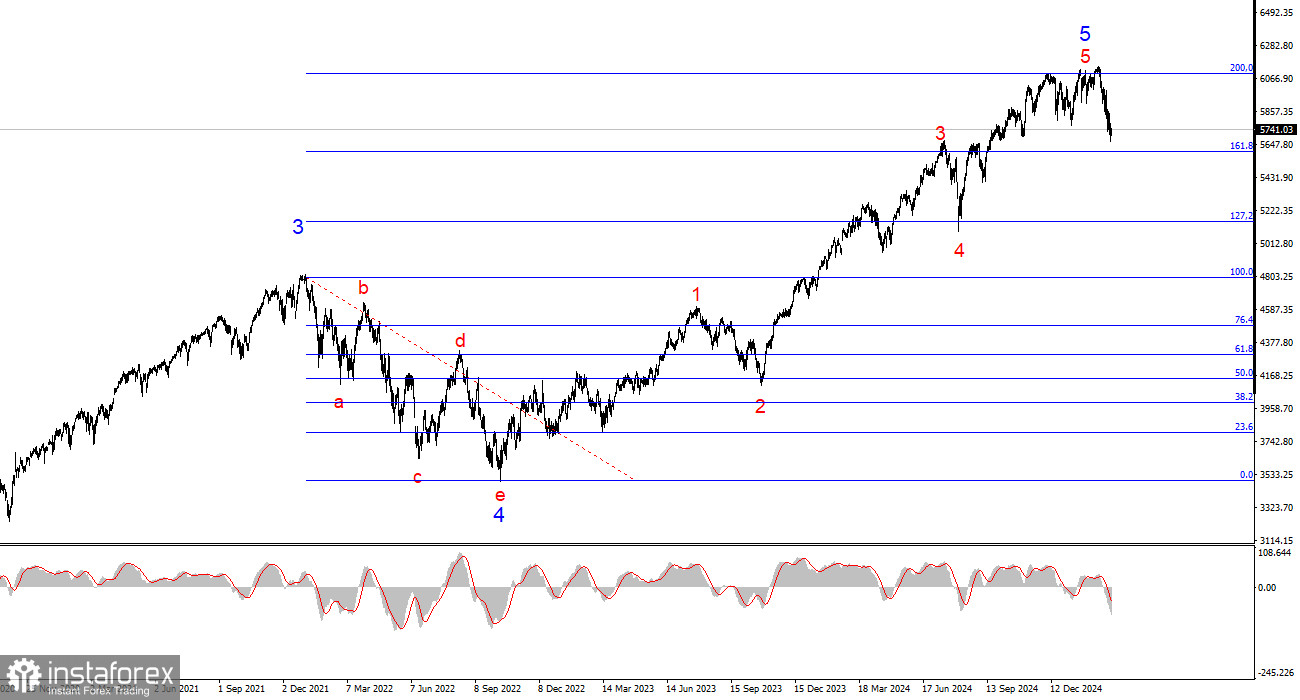
Based on my analysis of the S&P 500 (#SPX), I conclude that the index has completed its upward trend. Given the 6,125 level and Trump's economic policies, my bias remains bearish. The president's trade wars, tariffs, and import duties are destabilizing the U.S. economy and American businesses, making a downtrend increasingly likely. The U.S. stock market bubble appears to have reached its limit.
Core Principles of My Analysis:
*El análisis de mercado publicado aquí tiene la finalidad de incrementar su conocimiento, más no darle instrucciones para realizar una operación.
¡Los informes analíticos de InstaSpot lo mantendrá bien informado de las tendencias del mercado! Al ser un cliente de InstaSpot, se le proporciona una gran cantidad de servicios gratuitos para una operación eficiente.


