


¡Nuestro equipo cuenta con más de 7,000,000 operadores!
Cada día, trabajamos juntos para mejorar las operaciones. Obtenemos grandes resultados y seguimos adelante.
El reconocimiento de millones de operadores en todo el mundo es el mejor agradecimiento a nuestro trabajo! ¡Usted hizo su elección y haremos todo lo que esté a nuestro alcance para satisfacer sus expectativas!
¡Juntos somos un gran equipo!
InstaSpot. ¡Orgulloso de trabajar para usted!


¡Actor, 6 veces ganador del torneo UFC y un verdadero héroe!
El hombre que se hizo a sí mismo. El hombre que sigue nuestro camino.
El secreto detrás del éxito de Taktarov es el constante movimiento hacia el objetivo.
¡Revele todo los lados de su talento!
Descubra, intente, fracase, ¡pero nunca se rinda!
InstaSpot. ¡Su historia de éxito comienza aquí!
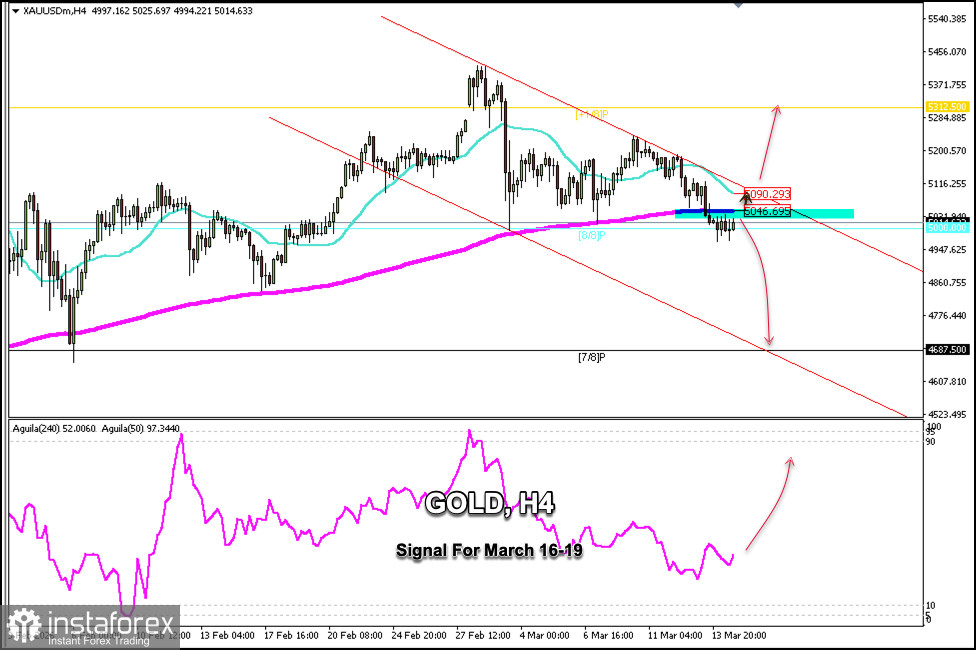
Gold is trading around $5,014, below the 200-day EMA and the 21-day SMA, under downward pressure, and is likely to continue falling in the coming hours.
If gold consolidates above the 200 EMA around $5,046 and breaks above this zone, the uptrend is expected to continue, with the price potentially reaching the 21 SMA around $5,090 and possibly even the top of the uptrend channel around $5,100.
If gold breaks above the 21 SMA and above the bearish trend channel, this could be seen as a buying opportunity, and gold could then return to levels around $5,250—last week's high—and could even reach February's high around $5,450.
Conversely, as long as the instrument trades below the 200 EMA, it means downward pressure. So, the metal is likely to continue falling in the coming hours until it reaches the weekly S_1 support level around $4,896.
Given that gold is showing a positive signal according to the Eagle indicator, we could expect the price to consolidate above $5,046 and then open long positions. We must be cautious, as the price could reach this zone and face strong resistance.
*El análisis de mercado publicado aquí tiene la finalidad de incrementar su conocimiento, más no darle instrucciones para realizar una operación.
¡Los informes analíticos de InstaSpot lo mantendrá bien informado de las tendencias del mercado! Al ser un cliente de InstaSpot, se le proporciona una gran cantidad de servicios gratuitos para una operación eficiente.


