


Kumpulan kami mempunyai lebih daripada 7,000,000 pedagang!
Setiap hari kami bekerjasama untuk meningkatkan perdagangan. Kami mendapat keputusan yang tinggi dan bergerak ke hadapan.
Pengiktirafan oleh berjuta-juta pedagang di seluruh dunia adalah penghargaan terbaik untuk kerja kami! Anda membuat pilihan anda dan kami akan melakukan segalanya yang diperlukan untuk memenuhi jangkaan anda!
Kami adalah kumpulan yang terbaik bersama!
InstaSpot. Berbangga bekerja untuk anda!


Pelakon, juara kejohanan UFC 6 dan seorang wira sebenar!
Lelaki yang membuat dirinya sendiri. Lelaki yang mengikut cara kami.
Rahsia di sebalik kejayaan Taktarov adalah pergerakan berterusan ke arah matlamat.
Dedahkan semua segi bakat anda!
Cari, cuba, gagal - tetapi tidak pernah berhenti!
InstaSpot. Kisah kejayaan anda bermula di sini!

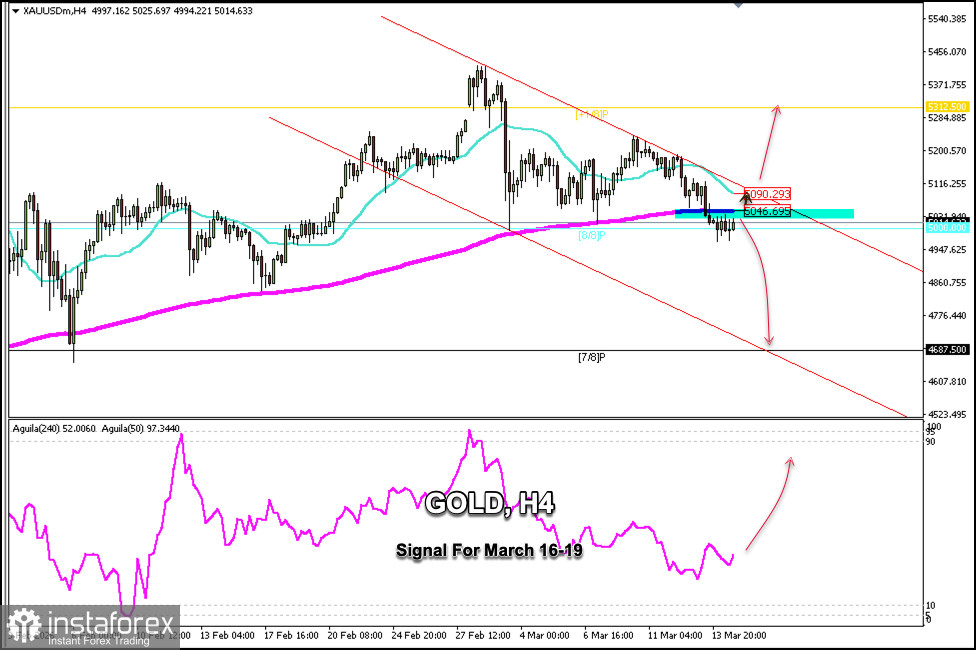
Gold is trading around $5,014, below the 200-day EMA and the 21-day SMA, under downward pressure, and is likely to continue falling in the coming hours.
If gold consolidates above the 200 EMA around $5,046 and breaks above this zone, the uptrend is expected to continue, with the price potentially reaching the 21 SMA around $5,090 and possibly even the top of the uptrend channel around $5,100.
If gold breaks above the 21 SMA and above the bearish trend channel, this could be seen as a buying opportunity, and gold could then return to levels around $5,250—last week's high—and could even reach February's high around $5,450.
Conversely, as long as the instrument trades below the 200 EMA, it means downward pressure. So, the metal is likely to continue falling in the coming hours until it reaches the weekly S_1 support level around $4,896.
Given that gold is showing a positive signal according to the Eagle indicator, we could expect the price to consolidate above $5,046 and then open long positions. We must be cautious, as the price could reach this zone and face strong resistance.
* Analisis pasaran yang disiarkan di sini adalah bertujuan untuk meningkatkan kesedaran anda, tetapi tidak untuk memberi arahan untuk membuat perdagangan.
Kajian analisis InstaSpot akan membuat anda mengetahui sepenuhnya aliran pasaran! Sebagai pelanggan InstaSpot, anda disediakan sejumlah besar perkhidmatan percuma untuk dagangan yang cekap.


