


Our team has over 7,000,000 traders!
Every day we work together to improve trading. We get high results and move forward.
Recognition by millions of traders all over the world is the best appreciation of our work! You made your choice and we will do everything it takes to meet your expectations!
We are a great team together!
InstaSpot. Proud to work for you!


Actor, UFC 6 tournament champion and a true hero!
The man who made himself. The man that goes our way.
The secret behind Taktarov's success is constant movement towards the goal.
Reveal all the sides of your talent!
Discover, try, fail - but never stop!
InstaSpot. Your success story starts here!

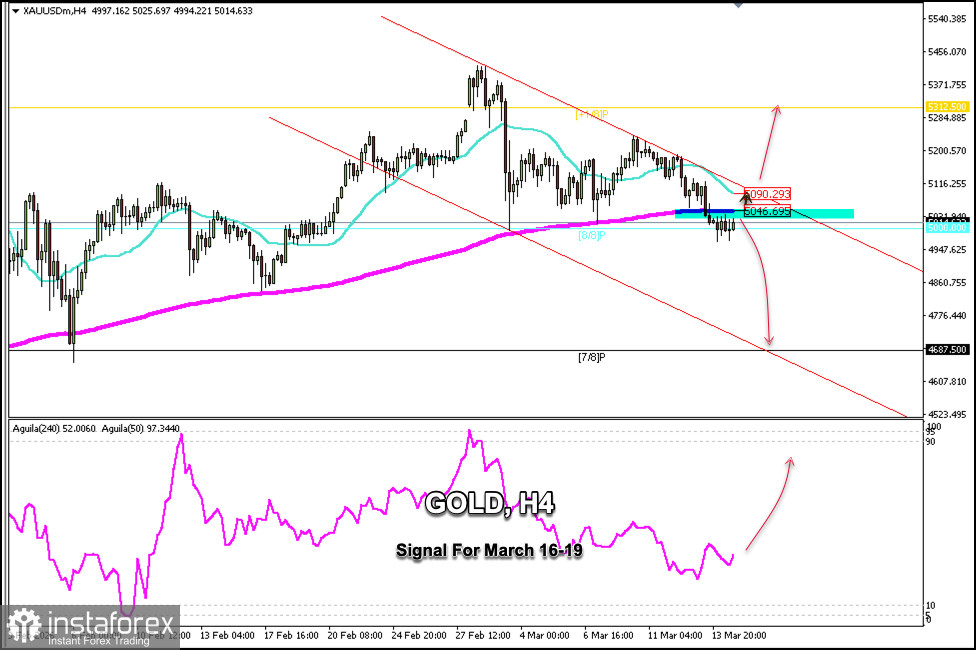
Gold is trading around $5,014, below the 200-day EMA and the 21-day SMA, under downward pressure, and is likely to continue falling in the coming hours.
If gold consolidates above the 200 EMA around $5,046 and breaks above this zone, the uptrend is expected to continue, with the price potentially reaching the 21 SMA around $5,090 and possibly even the top of the uptrend channel around $5,100.
If gold breaks above the 21 SMA and above the bearish trend channel, this could be seen as a buying opportunity, and gold could then return to levels around $5,250—last week's high—and could even reach February's high around $5,450.
Conversely, as long as the instrument trades below the 200 EMA, it means downward pressure. So, the metal is likely to continue falling in the coming hours until it reaches the weekly S_1 support level around $4,896.
Given that gold is showing a positive signal according to the Eagle indicator, we could expect the price to consolidate above $5,046 and then open long positions. We must be cautious, as the price could reach this zone and face strong resistance.
*এখানে পোস্ট করা মার্কেট বিশ্লেষণ আপনার সচেতনতা বৃদ্ধির জন্য প্রদান করা হয়, ট্রেড করার নির্দেশনা প্রদানের জন্য প্রদান করা হয় না।
ইন্সটাফরেক্স বিশ্লেষণমূলক পর্যালোচনাগুলো আপনাকে মার্কেট প্রবণতা সম্পর্কে পুরোপুরি সচেতন করবে! ইন্সটাফরেক্সের একজন গ্রাহক হওয়ায়, দক্ষ ট্রেডিং এর জন্য আপনাকে অনেক সেবা বিনামূল্যে প্রদান করা হয়।


