


¡Nuestro equipo cuenta con más de 7,000,000 operadores!
Cada día, trabajamos juntos para mejorar las operaciones. Obtenemos grandes resultados y seguimos adelante.
El reconocimiento de millones de operadores en todo el mundo es el mejor agradecimiento a nuestro trabajo! ¡Usted hizo su elección y haremos todo lo que esté a nuestro alcance para satisfacer sus expectativas!
¡Juntos somos un gran equipo!
InstaSpot. ¡Orgulloso de trabajar para usted!


¡Actor, 6 veces ganador del torneo UFC y un verdadero héroe!
El hombre que se hizo a sí mismo. El hombre que sigue nuestro camino.
El secreto detrás del éxito de Taktarov es el constante movimiento hacia el objetivo.
¡Revele todo los lados de su talento!
Descubra, intente, fracase, ¡pero nunca se rinda!
InstaSpot. ¡Su historia de éxito comienza aquí!
The results of the Bank of England's March meeting and comments from its leaders exerted pressure on the pound and the GBP/USD pair.
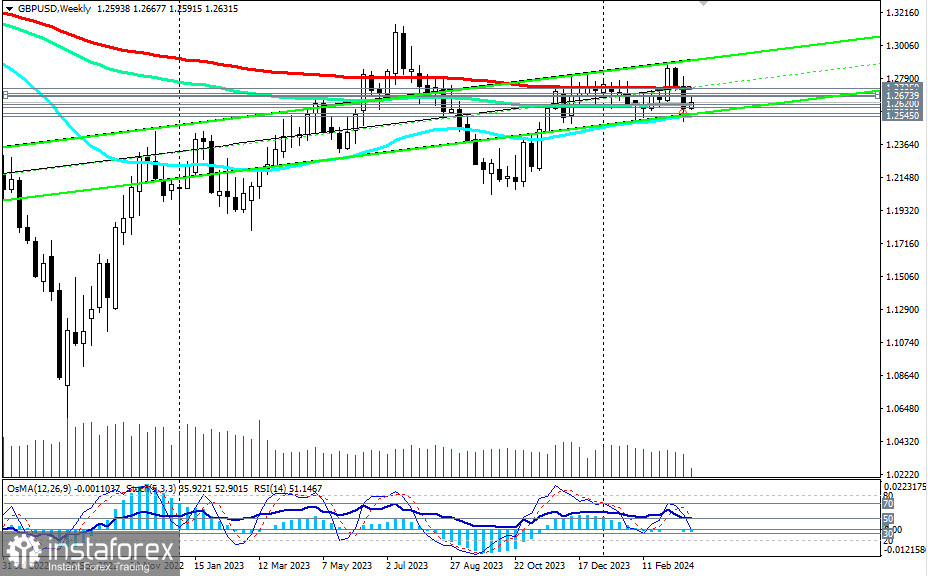
The next day, the pair tested key support levels for a breakthrough: 1.2565 (200 EMA on the daily chart) and 1.2545 (50 EMA on the weekly chart), separating the medium-term bullish market from the bearish one.
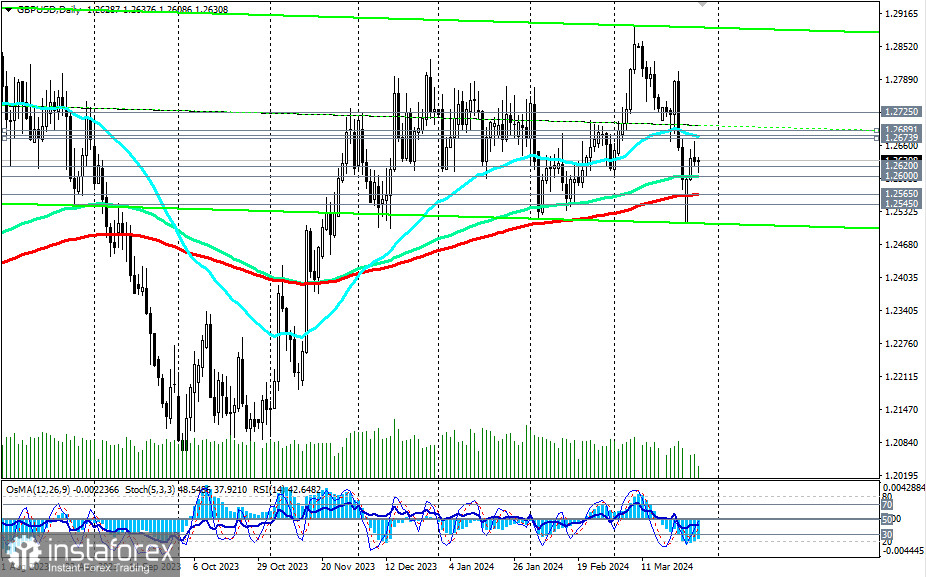
Subsequently, GBP/USD managed to recover somewhat, rising from a local low of 1.2510 to the resistance zone at levels 1.2674 (200 EMA on the 1-hour chart), 1.2680 (50 EMA on the daily chart), and 1.2689 (200 EMA on the 4-hour chart).
However, the corrective potential dried up near the 1.2667 mark, and GBP/USD resumed its decline.
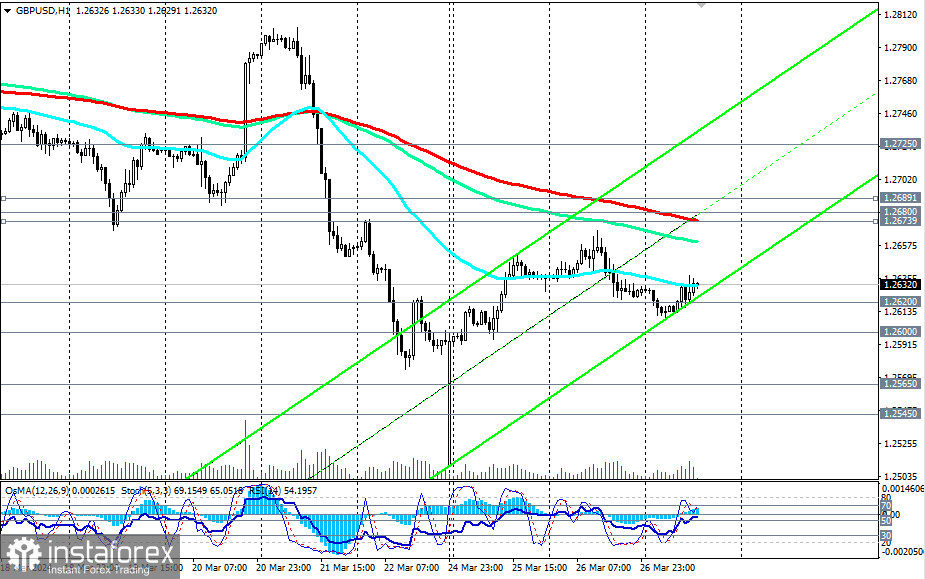
Thus, as of this writing, it was trading near the 1.2632 mark, declining towards the important support level of 1.2600 (144 EMA on the daily chart).
At the same time, technical indicators such as OsMA, RSI, and Stochastic on the daily and weekly charts are favoring sellers, signaling the advantage of short positions.
A breakout below the key support level of 1.2600 could be the first signal for new medium-term short positions, with the breakout of key support levels of 1.2565 and 1.2545 confirming this.
Moreover, below the key resistance level of 1.2725, GBP/USD is in the long-term bearish market zone, giving preference to long-term short positions.
In an alternative scenario, if GBP/USD resumes its rise, it will again head towards the resistance zone near levels 1.2674, 1.2680, and 1.2690. Their breakout could trigger further growth towards the key resistance level of 1.2725. Its breakout, in turn, will lead the pair into the long-term bullish market zone, which would be the first signal for long-term long positions.
For now, the advantage lies with the shorts.
Support levels: 1.2600, 1.25656, 1.2545, 1.2500
Resistance levels: 1.2674, 1.2680, 1.2689, 1.2700, 1.2725, 1.2800, 1.2830, 1.2860, 1.2890, 1.2900, 1.3000, 1.3100, 1.3140
Trading Scenarios:
Main scenario: Sell Stop 1.2590. Stop-Loss 1.2655. Targets 1.25656, 1.2545, 1.2500
Alternative scenario: Buy Stop 1.2655. Stop-Loss 1.2590. Targets 1.2674, 1.2680, 1.2689, 1.2700, 1.2725, 1.2800, 1.2830, 1.2860, 1.2890, 1.2900, 1.3000, 1.3100, 1.3140
"Targets" correspond to support/resistance levels. This also does not mean that they will necessarily be reached, but they can serve as a guide when planning and placing trading positions.
*El análisis de mercado publicado aquí tiene la finalidad de incrementar su conocimiento, más no darle instrucciones para realizar una operación.
¡Los informes analíticos de InstaSpot lo mantendrá bien informado de las tendencias del mercado! Al ser un cliente de InstaSpot, se le proporciona una gran cantidad de servicios gratuitos para una operación eficiente.


