


Our team has over 7,000,000 traders!
Every day we work together to improve trading. We get high results and move forward.
Recognition by millions of traders all over the world is the best appreciation of our work! You made your choice and we will do everything it takes to meet your expectations!
We are a great team together!
InstaSpot. Proud to work for you!


Actor, UFC 6 tournament champion and a true hero!
The man who made himself. The man that goes our way.
The secret behind Taktarov's success is constant movement towards the goal.
Reveal all the sides of your talent!
Discover, try, fail - but never stop!
InstaSpot. Your success story starts here!

The results of the Bank of England's March meeting and comments from its leaders exerted pressure on the pound and the GBP/USD pair.
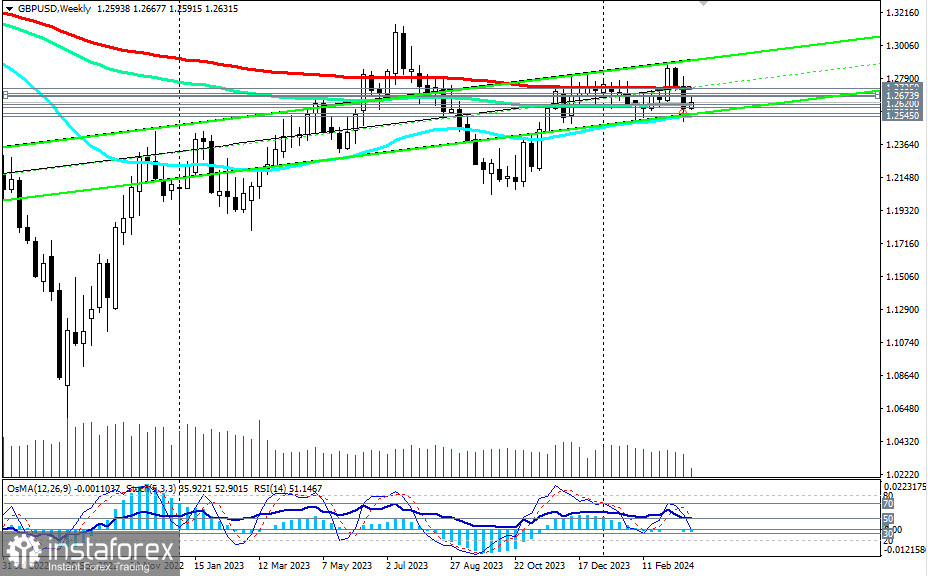
The next day, the pair tested key support levels for a breakthrough: 1.2565 (200 EMA on the daily chart) and 1.2545 (50 EMA on the weekly chart), separating the medium-term bullish market from the bearish one.
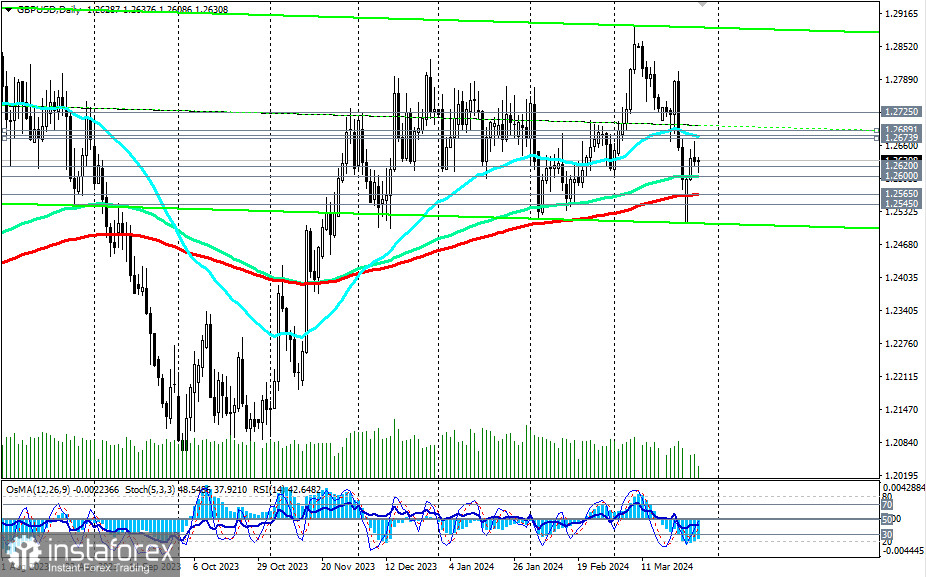
Subsequently, GBP/USD managed to recover somewhat, rising from a local low of 1.2510 to the resistance zone at levels 1.2674 (200 EMA on the 1-hour chart), 1.2680 (50 EMA on the daily chart), and 1.2689 (200 EMA on the 4-hour chart).
However, the corrective potential dried up near the 1.2667 mark, and GBP/USD resumed its decline.
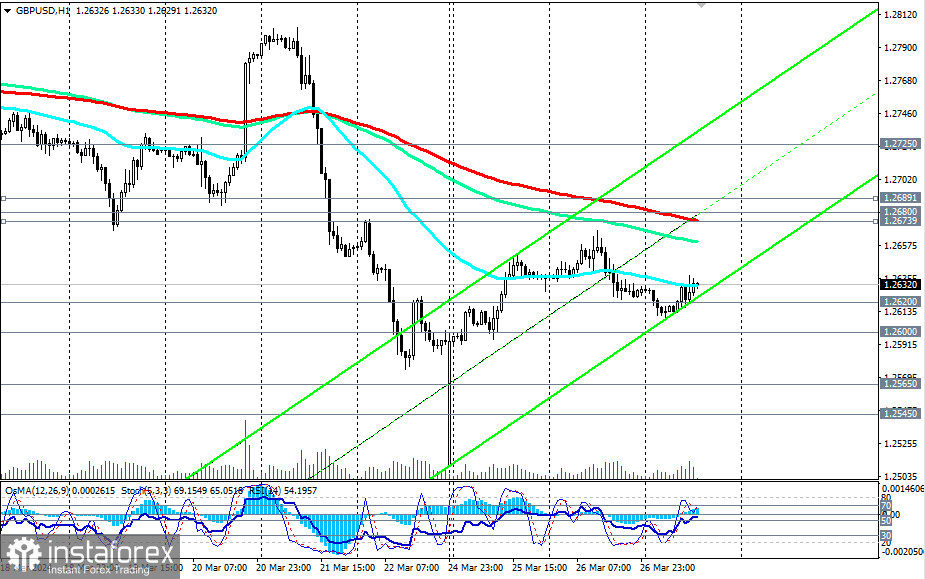
Thus, as of this writing, it was trading near the 1.2632 mark, declining towards the important support level of 1.2600 (144 EMA on the daily chart).
At the same time, technical indicators such as OsMA, RSI, and Stochastic on the daily and weekly charts are favoring sellers, signaling the advantage of short positions.
A breakout below the key support level of 1.2600 could be the first signal for new medium-term short positions, with the breakout of key support levels of 1.2565 and 1.2545 confirming this.
Moreover, below the key resistance level of 1.2725, GBP/USD is in the long-term bearish market zone, giving preference to long-term short positions.
In an alternative scenario, if GBP/USD resumes its rise, it will again head towards the resistance zone near levels 1.2674, 1.2680, and 1.2690. Their breakout could trigger further growth towards the key resistance level of 1.2725. Its breakout, in turn, will lead the pair into the long-term bullish market zone, which would be the first signal for long-term long positions.
For now, the advantage lies with the shorts.
Support levels: 1.2600, 1.25656, 1.2545, 1.2500
Resistance levels: 1.2674, 1.2680, 1.2689, 1.2700, 1.2725, 1.2800, 1.2830, 1.2860, 1.2890, 1.2900, 1.3000, 1.3100, 1.3140
Trading Scenarios:
Main scenario: Sell Stop 1.2590. Stop-Loss 1.2655. Targets 1.25656, 1.2545, 1.2500
Alternative scenario: Buy Stop 1.2655. Stop-Loss 1.2590. Targets 1.2674, 1.2680, 1.2689, 1.2700, 1.2725, 1.2800, 1.2830, 1.2860, 1.2890, 1.2900, 1.3000, 1.3100, 1.3140
"Targets" correspond to support/resistance levels. This also does not mean that they will necessarily be reached, but they can serve as a guide when planning and placing trading positions.
*The market analysis posted here is meant to increase your awareness, but not to give instructions to make a trade.
InstaSpot analytical reviews will make you fully aware of market trends! Being an InstaSpot client, you are provided with a large number of free services for efficient trading.


