


Nella nostra squadra ci sono più di 7.000.000 trader! Ogni giorno ci impegniamo a far sì che il trading migliori. Conseguiamo grandi risultati e ci muoviamo in avanti.
Il riconoscimento da parte di milioni di trader in tutto il mondo rappresenta l'alta valutazione della nostra attività! Voi avete fatto la vostra scelta e noi faremo la nostra al fine di soddisfare le vostre aspettative!
Assieme siamo una grande squadra!
InstaSpot. Siamo orgogliosi di lavorare per voi!


Attore, campione del mondo di lotta libera e semplicemente un vero maciste russo! Persona venuta dal nulla. Persona che rispecchia i nostri obiettivi. Il segreto del successo di Taktarov consiste nel mirare continuamente al suo scopo.
Dischiudi anche tu tutti gli aspetti del tuo talento! Impara, prova, sbaglia, ma non fermarti!
InstaSpot - la storia delle tue vittorie inizia qui!

The results of the Bank of England's March meeting and comments from its leaders exerted pressure on the pound and the GBP/USD pair.
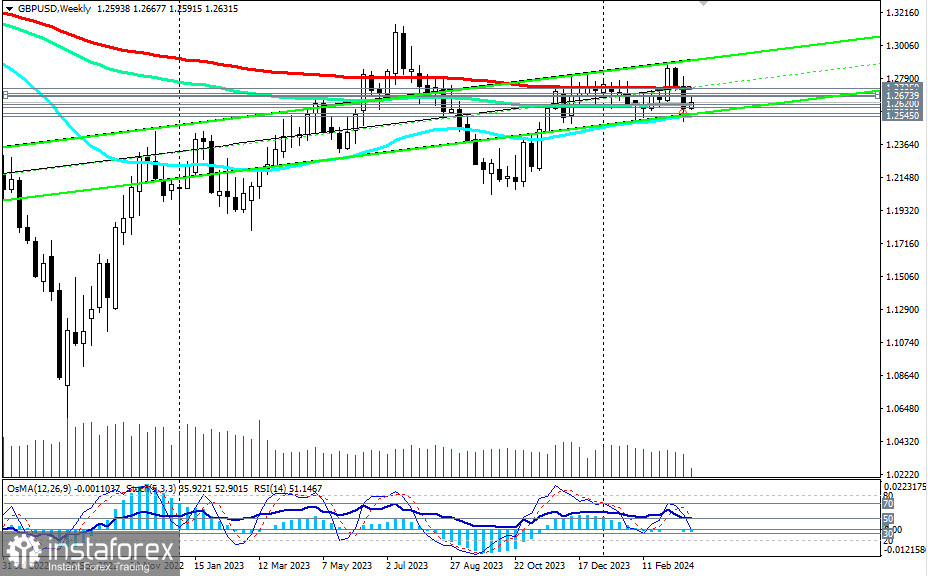
The next day, the pair tested key support levels for a breakthrough: 1.2565 (200 EMA on the daily chart) and 1.2545 (50 EMA on the weekly chart), separating the medium-term bullish market from the bearish one.
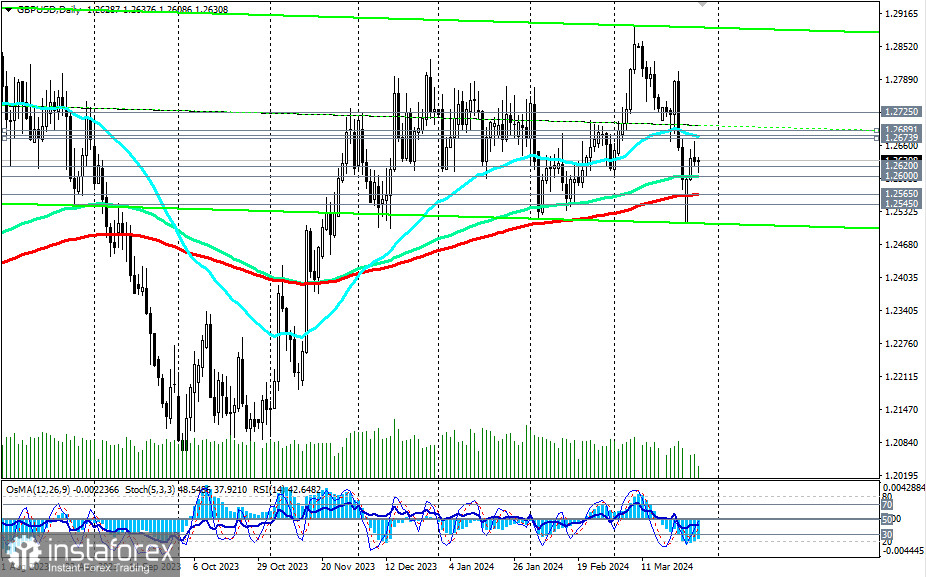
Subsequently, GBP/USD managed to recover somewhat, rising from a local low of 1.2510 to the resistance zone at levels 1.2674 (200 EMA on the 1-hour chart), 1.2680 (50 EMA on the daily chart), and 1.2689 (200 EMA on the 4-hour chart).
However, the corrective potential dried up near the 1.2667 mark, and GBP/USD resumed its decline.
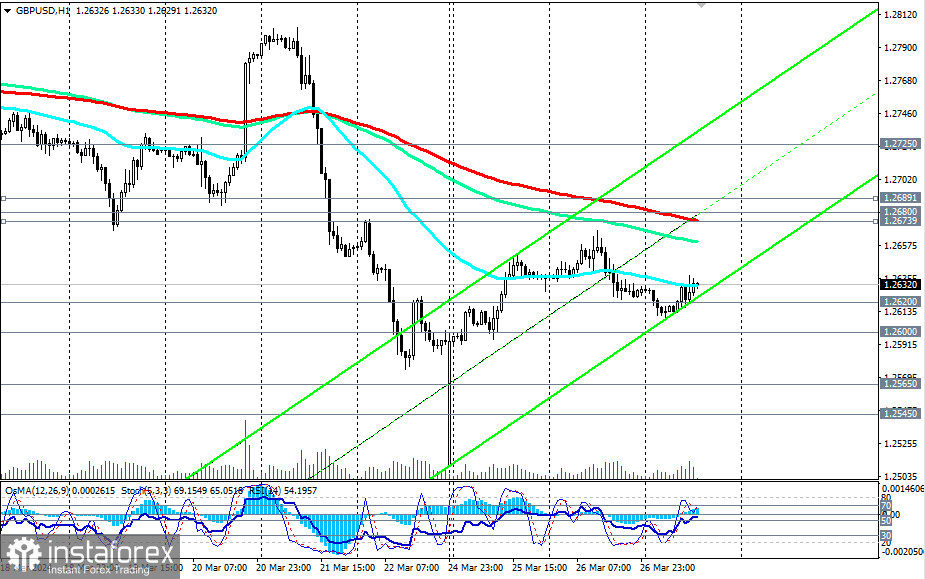
Thus, as of this writing, it was trading near the 1.2632 mark, declining towards the important support level of 1.2600 (144 EMA on the daily chart).
At the same time, technical indicators such as OsMA, RSI, and Stochastic on the daily and weekly charts are favoring sellers, signaling the advantage of short positions.
A breakout below the key support level of 1.2600 could be the first signal for new medium-term short positions, with the breakout of key support levels of 1.2565 and 1.2545 confirming this.
Moreover, below the key resistance level of 1.2725, GBP/USD is in the long-term bearish market zone, giving preference to long-term short positions.
In an alternative scenario, if GBP/USD resumes its rise, it will again head towards the resistance zone near levels 1.2674, 1.2680, and 1.2690. Their breakout could trigger further growth towards the key resistance level of 1.2725. Its breakout, in turn, will lead the pair into the long-term bullish market zone, which would be the first signal for long-term long positions.
For now, the advantage lies with the shorts.
Support levels: 1.2600, 1.25656, 1.2545, 1.2500
Resistance levels: 1.2674, 1.2680, 1.2689, 1.2700, 1.2725, 1.2800, 1.2830, 1.2860, 1.2890, 1.2900, 1.3000, 1.3100, 1.3140
Trading Scenarios:
Main scenario: Sell Stop 1.2590. Stop-Loss 1.2655. Targets 1.25656, 1.2545, 1.2500
Alternative scenario: Buy Stop 1.2655. Stop-Loss 1.2590. Targets 1.2674, 1.2680, 1.2689, 1.2700, 1.2725, 1.2800, 1.2830, 1.2860, 1.2890, 1.2900, 1.3000, 1.3100, 1.3140
"Targets" correspond to support/resistance levels. This also does not mean that they will necessarily be reached, but they can serve as a guide when planning and placing trading positions.
*La presente analisi del mercato ha un carattere esclusivamente informativo e non rappresenta una guida per l`effettuazione di una transazione.
Le recensioni analitiche di InstaSpot ti renderanno pienamente consapevole delle tendenze del mercato! Essendo un cliente InstaSpot, ti viene fornito un gran numero di servizi gratuiti per il trading efficiente.


