


¡Nuestro equipo cuenta con más de 7,000,000 operadores!
Cada día, trabajamos juntos para mejorar las operaciones. Obtenemos grandes resultados y seguimos adelante.
El reconocimiento de millones de operadores en todo el mundo es el mejor agradecimiento a nuestro trabajo! ¡Usted hizo su elección y haremos todo lo que esté a nuestro alcance para satisfacer sus expectativas!
¡Juntos somos un gran equipo!
InstaSpot. ¡Orgulloso de trabajar para usted!


¡Actor, 6 veces ganador del torneo UFC y un verdadero héroe!
El hombre que se hizo a sí mismo. El hombre que sigue nuestro camino.
El secreto detrás del éxito de Taktarov es el constante movimiento hacia el objetivo.
¡Revele todo los lados de su talento!
Descubra, intente, fracase, ¡pero nunca se rinda!
InstaSpot. ¡Su historia de éxito comienza aquí!
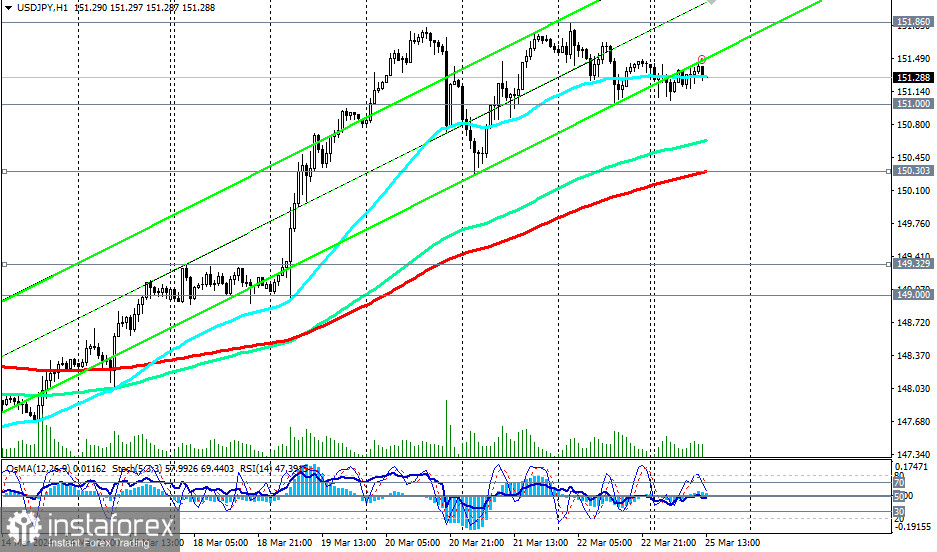
After reaching a local high of 151.86 last week, the USD/JPY pair today remains within a range between the levels of 150.30, 151.00, and 151.80 for the third consecutive trading day.
The important short-term support level (200 EMA on the 1-hour chart) also passes through the 150.30 mark. Therefore, a breakthrough of the 151.00 mark, followed by 150.30, could signal the start of a downward correction.
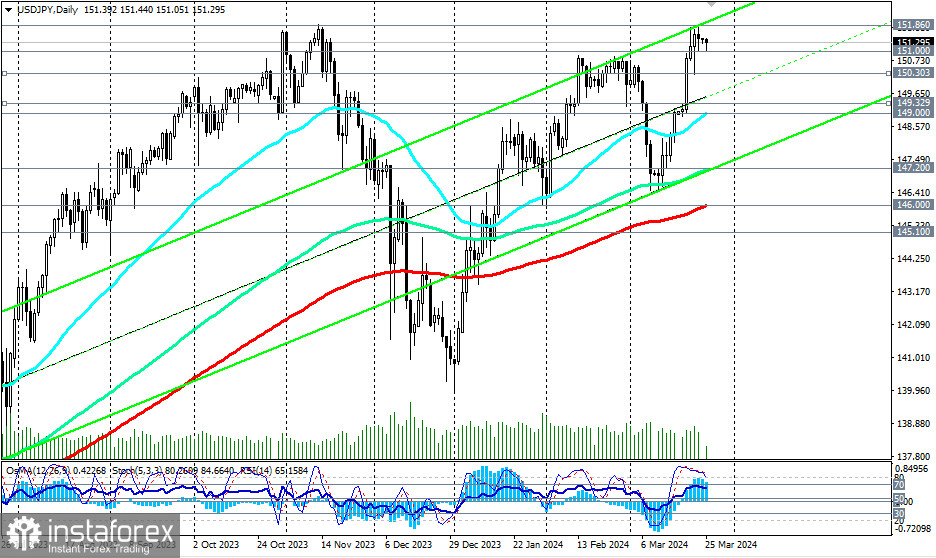
Considering the pair's overall bullish trend, this correction may be limited by support levels at 149.33 (200 EMA on the 4-hour chart) and 149.00 (50 EMA on the daily chart).
Only a breakthrough of the key support level at 146.00 (200 EMA on the daily chart) could lead the price into the zone of the medium-term bearish market, which could make short positions preferable.
For now, above the support levels of 151.00 and 150.30, preference should be given to long positions. In this case, a breakthrough of the local resistance at the 151.50 mark could be the first signal for new long positions, with a breakthrough of the 151.86 mark confirming it.
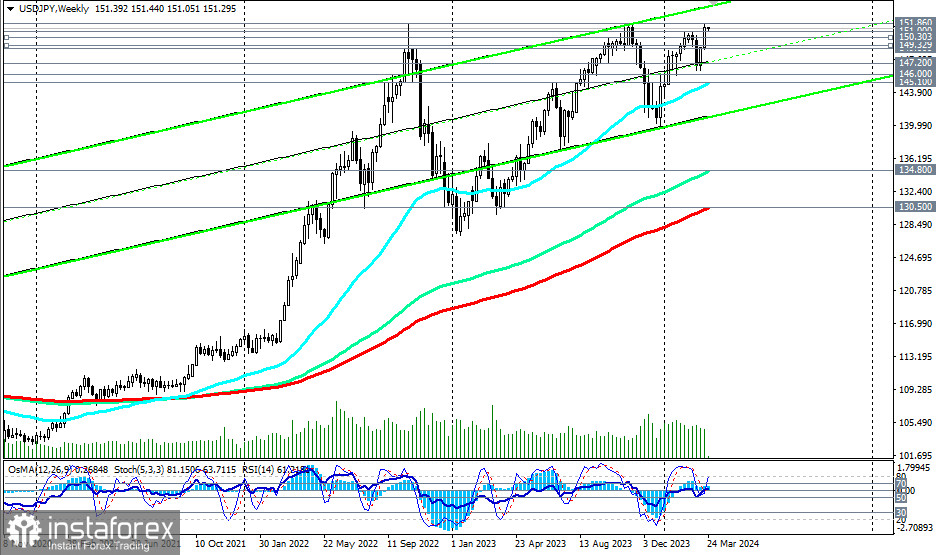
From a technical point of view, USD/JPY continues to trade in a bullish market zone, medium-term—above the key support level of 146.00 (200 EMA on the daily chart), and long-term—above the key support level of 130.50 (200 EMA on the weekly chart). Thus, both from a technical and fundamental point of view, long positions remain preferable for now.
Support levels: 151.00, 150.30, 150.00, 149.33, 149.00, 148.00, 147.20, 147.00, 146.00, 145.10, 145.00
Resistance levels: 151.50, 151.86, 152.00, 153.00
Trading scenarios
Main scenario
Aggressive: Buy at market, Buy Stop 151.60. Stop Loss 150.80
Moderate: Buy Stop 152.10. Stop Loss 151.40
Targets 153.00, 154.00, 155.00
Alternative scenario
Aggressive: Sell Stop 150.90. Stop Loss 151.60
Moderate: Sell Stop 150.20. Stop Loss 151.10
Targets 150.00, 149.33, 149.00, 148.00, 147.20, 147.00, 146.00, 145.10, 145.00
"Targets" correspond to support/resistance levels. This also does not mean that they will necessarily be reached, but they can serve as a guide when planning and placing trading positions.
*El análisis de mercado publicado aquí tiene la finalidad de incrementar su conocimiento, más no darle instrucciones para realizar una operación.
¡Los informes analíticos de InstaSpot lo mantendrá bien informado de las tendencias del mercado! Al ser un cliente de InstaSpot, se le proporciona una gran cantidad de servicios gratuitos para una operación eficiente.


