


Kumpulan kami mempunyai lebih daripada 7,000,000 pedagang!
Setiap hari kami bekerjasama untuk meningkatkan perdagangan. Kami mendapat keputusan yang tinggi dan bergerak ke hadapan.
Pengiktirafan oleh berjuta-juta pedagang di seluruh dunia adalah penghargaan terbaik untuk kerja kami! Anda membuat pilihan anda dan kami akan melakukan segalanya yang diperlukan untuk memenuhi jangkaan anda!
Kami adalah kumpulan yang terbaik bersama!
InstaSpot. Berbangga bekerja untuk anda!


Pelakon, juara kejohanan UFC 6 dan seorang wira sebenar!
Lelaki yang membuat dirinya sendiri. Lelaki yang mengikut cara kami.
Rahsia di sebalik kejayaan Taktarov adalah pergerakan berterusan ke arah matlamat.
Dedahkan semua segi bakat anda!
Cari, cuba, gagal - tetapi tidak pernah berhenti!
InstaSpot. Kisah kejayaan anda bermula di sini!

After reaching a local high of 151.86 last week, the USD/JPY pair today remains within a range between the levels of 150.30, 151.00, and 151.80 for the third consecutive trading day.
The important short-term support level (200 EMA on the 1-hour chart) also passes through the 150.30 mark. Therefore, a breakthrough of the 151.00 mark, followed by 150.30, could signal the start of a downward correction.
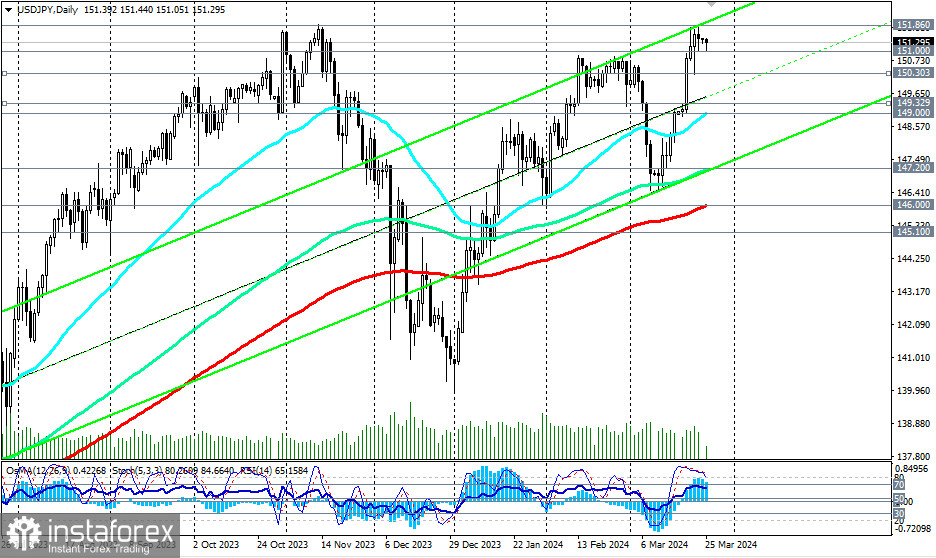
Considering the pair's overall bullish trend, this correction may be limited by support levels at 149.33 (200 EMA on the 4-hour chart) and 149.00 (50 EMA on the daily chart).
Only a breakthrough of the key support level at 146.00 (200 EMA on the daily chart) could lead the price into the zone of the medium-term bearish market, which could make short positions preferable.
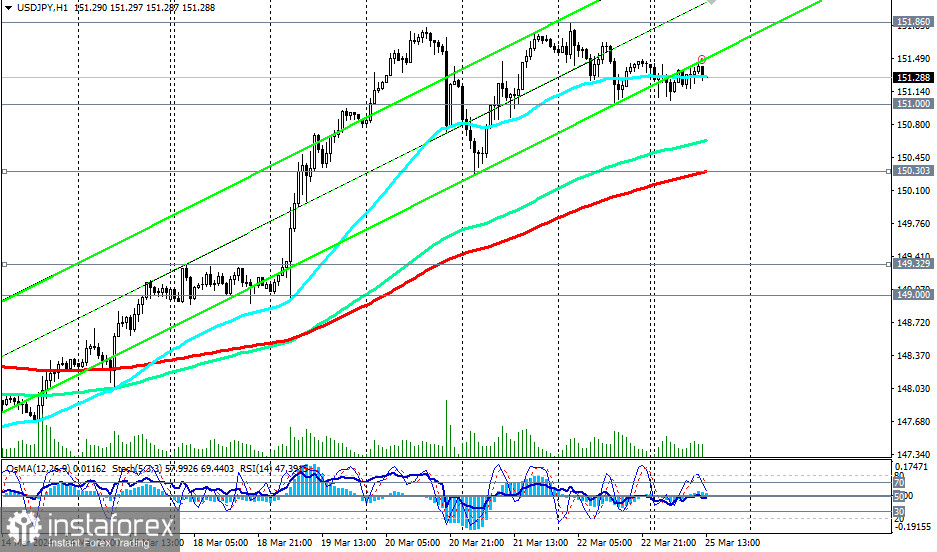
For now, above the support levels of 151.00 and 150.30, preference should be given to long positions. In this case, a breakthrough of the local resistance at the 151.50 mark could be the first signal for new long positions, with a breakthrough of the 151.86 mark confirming it.
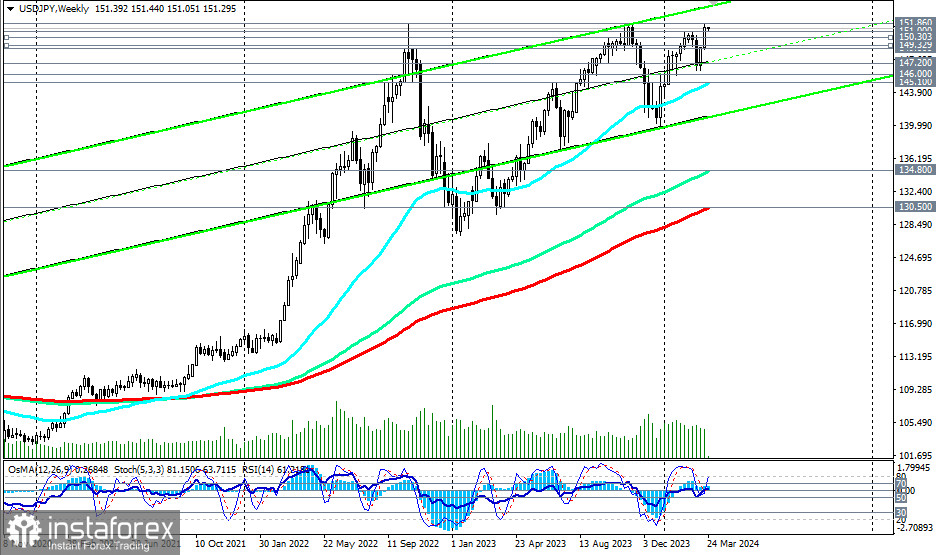
From a technical point of view, USD/JPY continues to trade in a bullish market zone, medium-term—above the key support level of 146.00 (200 EMA on the daily chart), and long-term—above the key support level of 130.50 (200 EMA on the weekly chart). Thus, both from a technical and fundamental point of view, long positions remain preferable for now.
Support levels: 151.00, 150.30, 150.00, 149.33, 149.00, 148.00, 147.20, 147.00, 146.00, 145.10, 145.00
Resistance levels: 151.50, 151.86, 152.00, 153.00
Trading scenarios
Main scenario
Aggressive: Buy at market, Buy Stop 151.60. Stop Loss 150.80
Moderate: Buy Stop 152.10. Stop Loss 151.40
Targets 153.00, 154.00, 155.00
Alternative scenario
Aggressive: Sell Stop 150.90. Stop Loss 151.60
Moderate: Sell Stop 150.20. Stop Loss 151.10
Targets 150.00, 149.33, 149.00, 148.00, 147.20, 147.00, 146.00, 145.10, 145.00
"Targets" correspond to support/resistance levels. This also does not mean that they will necessarily be reached, but they can serve as a guide when planning and placing trading positions.
* Analisis pasaran yang disiarkan di sini adalah bertujuan untuk meningkatkan kesedaran anda, tetapi tidak untuk memberi arahan untuk membuat perdagangan.
Kajian analisis InstaSpot akan membuat anda mengetahui sepenuhnya aliran pasaran! Sebagai pelanggan InstaSpot, anda disediakan sejumlah besar perkhidmatan percuma untuk dagangan yang cekap.


