


Our team has over 7,000,000 traders!
Every day we work together to improve trading. We get high results and move forward.
Recognition by millions of traders all over the world is the best appreciation of our work! You made your choice and we will do everything it takes to meet your expectations!
We are a great team together!
InstaSpot. Proud to work for you!


Actor, UFC 6 tournament champion and a true hero!
The man who made himself. The man that goes our way.
The secret behind Taktarov's success is constant movement towards the goal.
Reveal all the sides of your talent!
Discover, try, fail - but never stop!
InstaSpot. Your success story starts here!

After reaching a local high of 151.86 last week, the USD/JPY pair today remains within a range between the levels of 150.30, 151.00, and 151.80 for the third consecutive trading day.
The important short-term support level (200 EMA on the 1-hour chart) also passes through the 150.30 mark. Therefore, a breakthrough of the 151.00 mark, followed by 150.30, could signal the start of a downward correction.
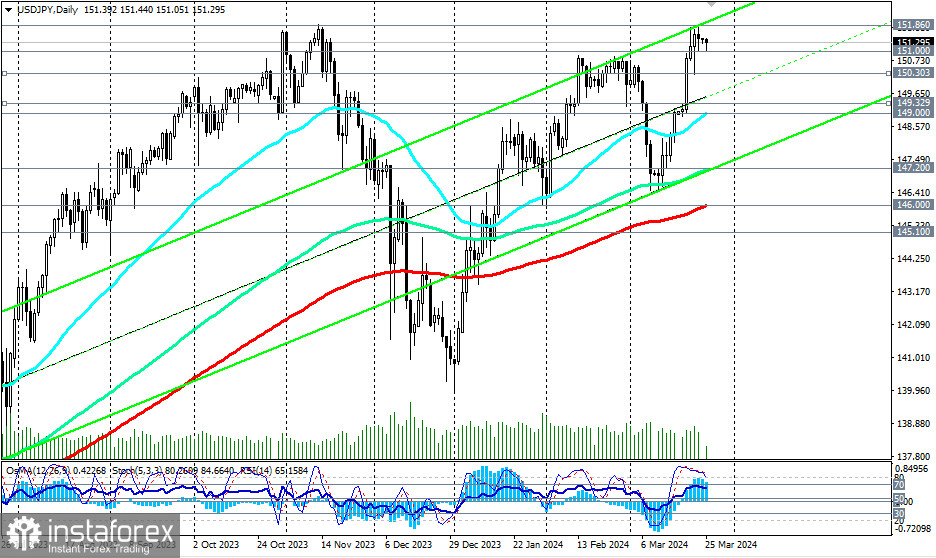
Considering the pair's overall bullish trend, this correction may be limited by support levels at 149.33 (200 EMA on the 4-hour chart) and 149.00 (50 EMA on the daily chart).
Only a breakthrough of the key support level at 146.00 (200 EMA on the daily chart) could lead the price into the zone of the medium-term bearish market, which could make short positions preferable.
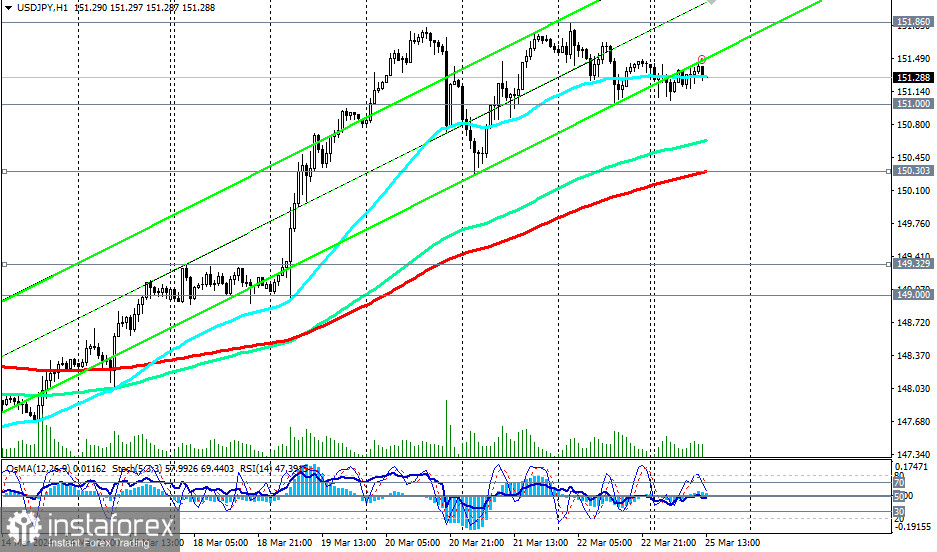
For now, above the support levels of 151.00 and 150.30, preference should be given to long positions. In this case, a breakthrough of the local resistance at the 151.50 mark could be the first signal for new long positions, with a breakthrough of the 151.86 mark confirming it.
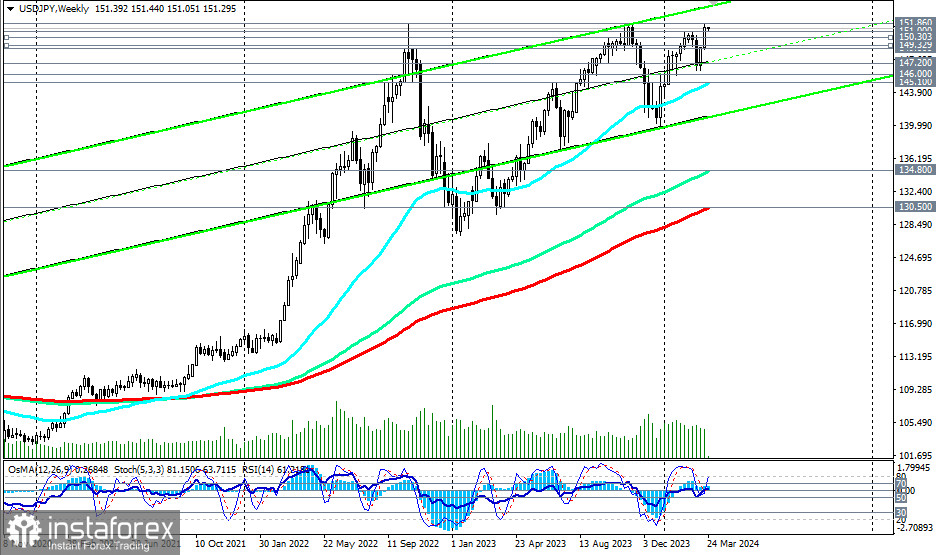
From a technical point of view, USD/JPY continues to trade in a bullish market zone, medium-term—above the key support level of 146.00 (200 EMA on the daily chart), and long-term—above the key support level of 130.50 (200 EMA on the weekly chart). Thus, both from a technical and fundamental point of view, long positions remain preferable for now.
Support levels: 151.00, 150.30, 150.00, 149.33, 149.00, 148.00, 147.20, 147.00, 146.00, 145.10, 145.00
Resistance levels: 151.50, 151.86, 152.00, 153.00
Trading scenarios
Main scenario
Aggressive: Buy at market, Buy Stop 151.60. Stop Loss 150.80
Moderate: Buy Stop 152.10. Stop Loss 151.40
Targets 153.00, 154.00, 155.00
Alternative scenario
Aggressive: Sell Stop 150.90. Stop Loss 151.60
Moderate: Sell Stop 150.20. Stop Loss 151.10
Targets 150.00, 149.33, 149.00, 148.00, 147.20, 147.00, 146.00, 145.10, 145.00
"Targets" correspond to support/resistance levels. This also does not mean that they will necessarily be reached, but they can serve as a guide when planning and placing trading positions.
*এখানে পোস্ট করা মার্কেট বিশ্লেষণ আপনার সচেতনতা বৃদ্ধির জন্য প্রদান করা হয়, ট্রেড করার নির্দেশনা প্রদানের জন্য প্রদান করা হয় না।
ইন্সটাফরেক্স বিশ্লেষণমূলক পর্যালোচনাগুলো আপনাকে মার্কেট প্রবণতা সম্পর্কে পুরোপুরি সচেতন করবে! ইন্সটাফরেক্সের একজন গ্রাহক হওয়ায়, দক্ষ ট্রেডিং এর জন্য আপনাকে অনেক সেবা বিনামূল্যে প্রদান করা হয়।


