


¡La leyenda en el equipo de InstaSpot!
¡Leyenda! ¿Cree que es una retórica grandilocuente? Pero, ¿cómo deberíamos llamar a un hombre, que se convirtió en el primer asiático en ganar el campeonato mundial de ajedrez júnior a los 18 años y en el primer Gran Maestro indio a los 19 años? Ese fue el comienzo de un camino difícil hacia el título de Campeón del Mundo para Viswanathan Anand, el hombre que se convirtió en parte de la historia del ajedrez para siempre. ¡Ahora una leyenda más en el equipo de InstaSpot!


Borussia es uno de los clubes de fútbol con más títulos en Alemania, que ha demostrado repetidamente a los fanáticos: el espíritu de competencia y liderazgo que ciertamente conducirán al éxito. Opere de la misma manera que los profesionales del deporte: con confianza y de forma activa. ¡Mantenga un "pase" del Borussia FC y lidere con InstaSpot!
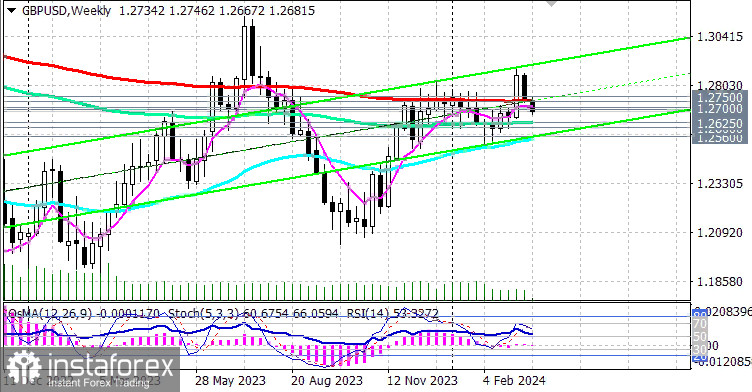
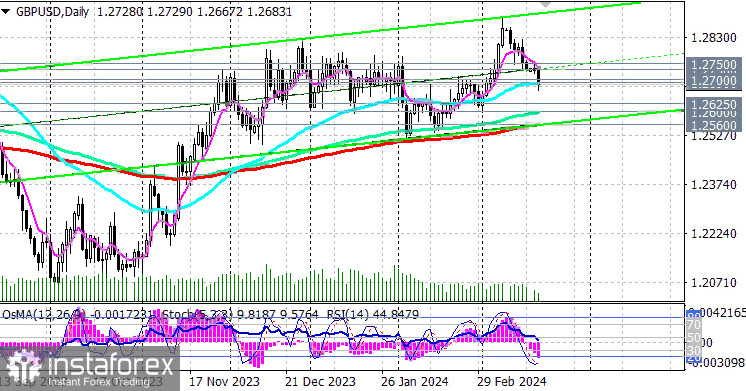
As of this writing, GBP/USD is trading near the 1.2690 mark and the support level represented by the 50-period moving average on the daily price chart, attempting to deepen into the zone of the long-term bearish market located below the key support level of 1.2730 (200 EMA on the weekly chart).
Since the beginning of last week, the pair has continued to develop negative dynamics after an unsuccessful attempt to break into the zone of the long-term bullish market.
The inflation data published in the United States last week, indicating its acceleration in February, contributed to the strengthening of the dollar across the market, including the GBP/USD pair. Now, market participants' opinion tends towards a later start of the Fed's monetary policy easing cycle than previously forecasted, which supports the strengthening of the dollar.
In the event of further strengthening, we should expect a breakthrough of the support level at 1.2690 and a decline to important support levels at 1.2625 (144 EMA on the weekly chart), 1.2600 (144 EMA on the daily chart).
A breakthrough of the key support level at 1.2560 will lead GBP/USD into the zone of the medium-term bearish market, making long-term and medium-term short positions preferable.
Technical indicators RSI, OsMA, and Stochastic on the daily price chart are also in favor of sellers.
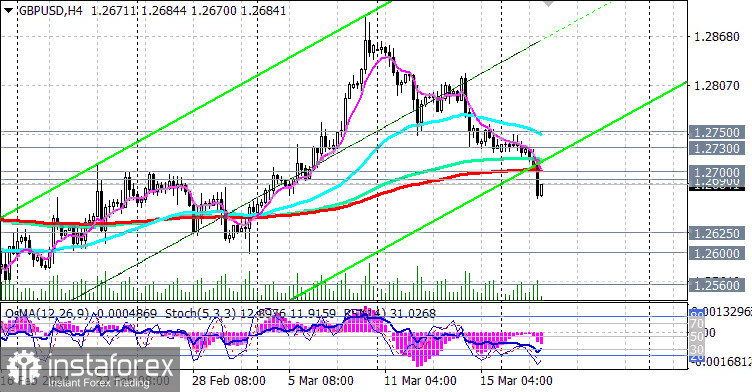
In the alternative scenario, a breakthrough of the short-term resistance level at 1.2700 (200 EMA on the 4-hour chart and the local resistance level) will be the first signal for the resumption of long positions, and a breakthrough of the resistance levels at 1.2730, 1.2750 (200 EMA on the 1-hour chart) will be confirming.
Support levels: 1.2690, 1.2625, 1.2600, 1.2560, 1.2500
Resistance levels: 1.2700, 1.2730, 1.2750, 1.2800, 1.2870, 1.2900, 1.3000, 1.3100
Trading scenarios:
Main scenario: Sell Stop 1.2660. Stop-Loss 1.2710. Take-Profit 1.2625, 1.2600, 1.2560, 1.2500, 1.2400
Alternative scenario: Buy Stop 1.2710. Stop-Loss 1.2660. Take-Profit 1.2730, 1.2750, 1.2800, 1.2870, 1.2900, 1.3000, 1.3100, 1.3190, 1.3275, 1.3300, 1.3390, 1.3430, 1.3535, 1.3640, 1.3700, 1.3745, 1.3900, 1.3970, 1.4000
*El análisis de mercado publicado aquí tiene la finalidad de incrementar su conocimiento, más no darle instrucciones para realizar una operación.
¡Los informes analíticos de InstaSpot lo mantendrá bien informado de las tendencias del mercado! Al ser un cliente de InstaSpot, se le proporciona una gran cantidad de servicios gratuitos para una operación eficiente.


