


Legenda dalam pasukan InstaSpot!
Legenda! Anda fikir ia adalah satu retorik yang besar? Tetapi bagaimana untuk kita memanggil seorang lelaki, yang telah menjadi pemain Asia pertama yang memenangi kejohanan catur dunia junior pada usia 18 tahun dan menjadi Grandmaster India pertama pada usia 19 tahun? Itulah permulaan yang sukar untuk merangkul gelaran Juara Dunia untuk Viswanathan Anand, seorang juara yang telah menjadi sebahagian daripada sejarah catur. Kini satu lagi legenda dalam pasukan InstaSpot!


Borussia adalah salah satu kelab bola sepak paling terkemuka di Jerman, yang telah berulang kali membuktikan kepada peminatnya: semangat persaingan dan kepemimpinan pasti akan membawa kepada kejayaan. Berdagang dengan cara yang sama seperti atlet sukan profesional beraksi menentang lawan: yakin dan aktif. Simpan "hantaran" dari Borussia FC dan menjadi pedagang hebat dengan InstaSpot!

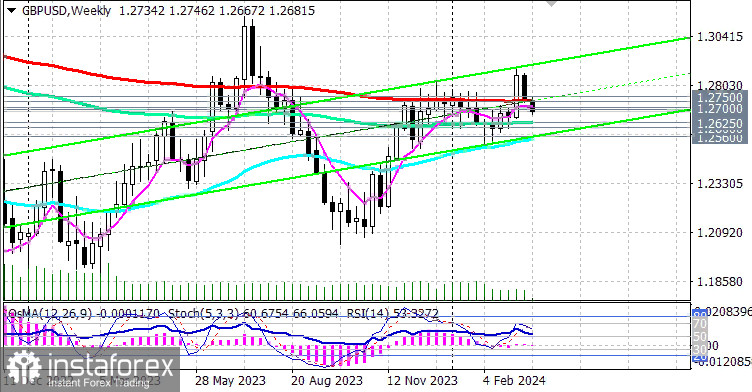
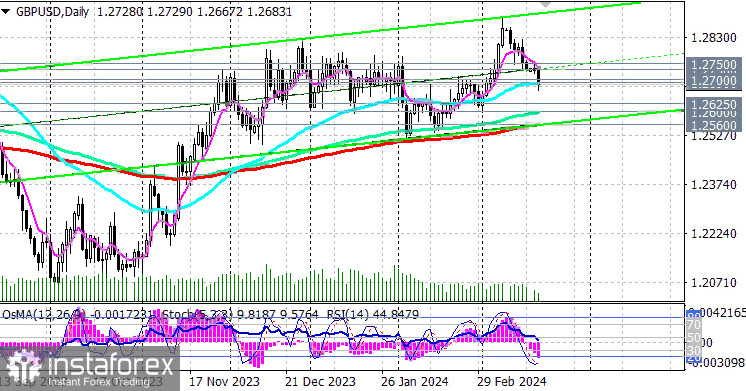
As of this writing, GBP/USD is trading near the 1.2690 mark and the support level represented by the 50-period moving average on the daily price chart, attempting to deepen into the zone of the long-term bearish market located below the key support level of 1.2730 (200 EMA on the weekly chart).
Since the beginning of last week, the pair has continued to develop negative dynamics after an unsuccessful attempt to break into the zone of the long-term bullish market.
The inflation data published in the United States last week, indicating its acceleration in February, contributed to the strengthening of the dollar across the market, including the GBP/USD pair. Now, market participants' opinion tends towards a later start of the Fed's monetary policy easing cycle than previously forecasted, which supports the strengthening of the dollar.
In the event of further strengthening, we should expect a breakthrough of the support level at 1.2690 and a decline to important support levels at 1.2625 (144 EMA on the weekly chart), 1.2600 (144 EMA on the daily chart).
A breakthrough of the key support level at 1.2560 will lead GBP/USD into the zone of the medium-term bearish market, making long-term and medium-term short positions preferable.
Technical indicators RSI, OsMA, and Stochastic on the daily price chart are also in favor of sellers.
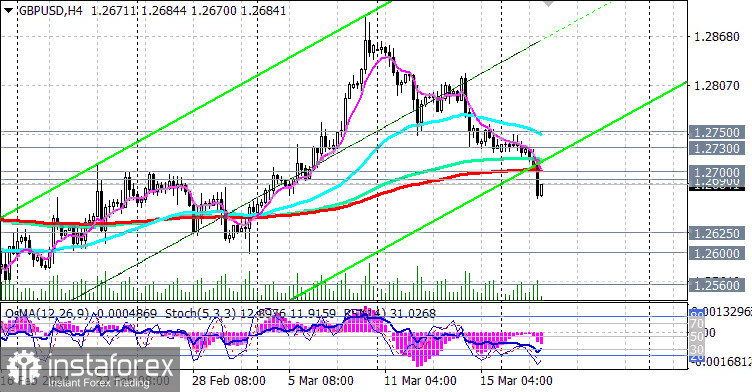
In the alternative scenario, a breakthrough of the short-term resistance level at 1.2700 (200 EMA on the 4-hour chart and the local resistance level) will be the first signal for the resumption of long positions, and a breakthrough of the resistance levels at 1.2730, 1.2750 (200 EMA on the 1-hour chart) will be confirming.
Support levels: 1.2690, 1.2625, 1.2600, 1.2560, 1.2500
Resistance levels: 1.2700, 1.2730, 1.2750, 1.2800, 1.2870, 1.2900, 1.3000, 1.3100
Trading scenarios:
Main scenario: Sell Stop 1.2660. Stop-Loss 1.2710. Take-Profit 1.2625, 1.2600, 1.2560, 1.2500, 1.2400
Alternative scenario: Buy Stop 1.2710. Stop-Loss 1.2660. Take-Profit 1.2730, 1.2750, 1.2800, 1.2870, 1.2900, 1.3000, 1.3100, 1.3190, 1.3275, 1.3300, 1.3390, 1.3430, 1.3535, 1.3640, 1.3700, 1.3745, 1.3900, 1.3970, 1.4000
* Analisis pasaran yang disiarkan di sini adalah bertujuan untuk meningkatkan kesedaran anda, tetapi tidak untuk memberi arahan untuk membuat perdagangan.
Kajian analisis InstaSpot akan membuat anda mengetahui sepenuhnya aliran pasaran! Sebagai pelanggan InstaSpot, anda disediakan sejumlah besar perkhidmatan percuma untuk dagangan yang cekap.


