


The legend in the InstaSpot team!
Legend! You think that's bombastic rhetoric? But how should we call a man, who became the first Asian to win the junior world chess championship at 18 and who became the first Indian Grandmaster at 19? That was the start of a hard path to the World Champion title for Viswanathan Anand, the man who became a part of history of chess forever. Now one more legend in the InstaSpot team!


Borussia is one of the most titled football clubs in Germany, which has repeatedly proved to fans: the spirit of competition and leadership will certainly lead to success. Trade in the same way that sports professionals play the game: confidently and actively. Keep a "pass" from Borussia FC and be in the lead with InstaSpot!

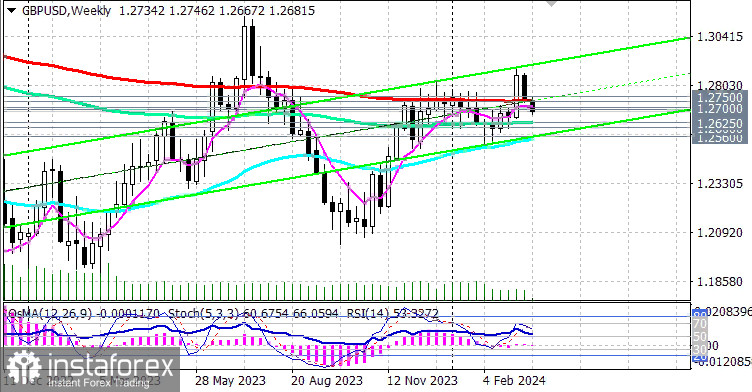
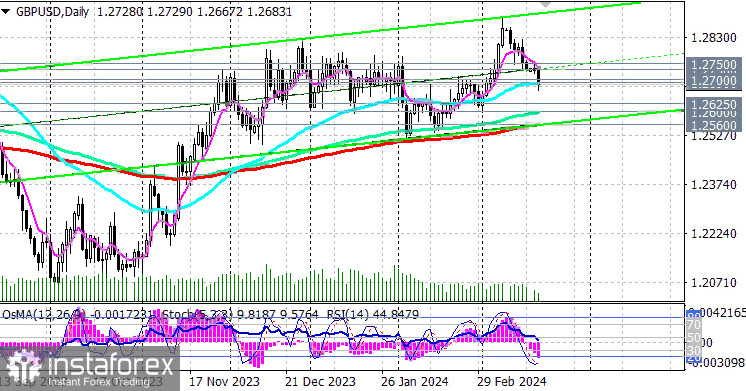
As of this writing, GBP/USD is trading near the 1.2690 mark and the support level represented by the 50-period moving average on the daily price chart, attempting to deepen into the zone of the long-term bearish market located below the key support level of 1.2730 (200 EMA on the weekly chart).
Since the beginning of last week, the pair has continued to develop negative dynamics after an unsuccessful attempt to break into the zone of the long-term bullish market.
The inflation data published in the United States last week, indicating its acceleration in February, contributed to the strengthening of the dollar across the market, including the GBP/USD pair. Now, market participants' opinion tends towards a later start of the Fed's monetary policy easing cycle than previously forecasted, which supports the strengthening of the dollar.
In the event of further strengthening, we should expect a breakthrough of the support level at 1.2690 and a decline to important support levels at 1.2625 (144 EMA on the weekly chart), 1.2600 (144 EMA on the daily chart).
A breakthrough of the key support level at 1.2560 will lead GBP/USD into the zone of the medium-term bearish market, making long-term and medium-term short positions preferable.
Technical indicators RSI, OsMA, and Stochastic on the daily price chart are also in favor of sellers.
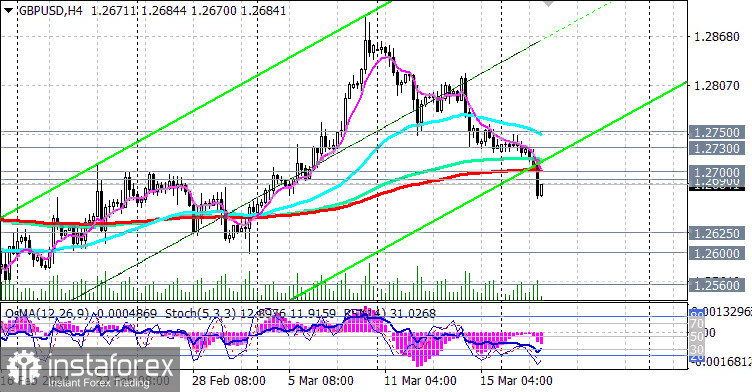
In the alternative scenario, a breakthrough of the short-term resistance level at 1.2700 (200 EMA on the 4-hour chart and the local resistance level) will be the first signal for the resumption of long positions, and a breakthrough of the resistance levels at 1.2730, 1.2750 (200 EMA on the 1-hour chart) will be confirming.
Support levels: 1.2690, 1.2625, 1.2600, 1.2560, 1.2500
Resistance levels: 1.2700, 1.2730, 1.2750, 1.2800, 1.2870, 1.2900, 1.3000, 1.3100
Trading scenarios:
Main scenario: Sell Stop 1.2660. Stop-Loss 1.2710. Take-Profit 1.2625, 1.2600, 1.2560, 1.2500, 1.2400
Alternative scenario: Buy Stop 1.2710. Stop-Loss 1.2660. Take-Profit 1.2730, 1.2750, 1.2800, 1.2870, 1.2900, 1.3000, 1.3100, 1.3190, 1.3275, 1.3300, 1.3390, 1.3430, 1.3535, 1.3640, 1.3700, 1.3745, 1.3900, 1.3970, 1.4000
*The market analysis posted here is meant to increase your awareness, but not to give instructions to make a trade.
InstaSpot analytical reviews will make you fully aware of market trends! Being an InstaSpot client, you are provided with a large number of free services for efficient trading.


