


¡La leyenda en el equipo de InstaSpot!
¡Leyenda! ¿Cree que es una retórica grandilocuente? Pero, ¿cómo deberíamos llamar a un hombre, que se convirtió en el primer asiático en ganar el campeonato mundial de ajedrez júnior a los 18 años y en el primer Gran Maestro indio a los 19 años? Ese fue el comienzo de un camino difícil hacia el título de Campeón del Mundo para Viswanathan Anand, el hombre que se convirtió en parte de la historia del ajedrez para siempre. ¡Ahora una leyenda más en el equipo de InstaSpot!


Borussia es uno de los clubes de fútbol con más títulos en Alemania, que ha demostrado repetidamente a los fanáticos: el espíritu de competencia y liderazgo que ciertamente conducirán al éxito. Opere de la misma manera que los profesionales del deporte: con confianza y de forma activa. ¡Mantenga un "pase" del Borussia FC y lidere con InstaSpot!
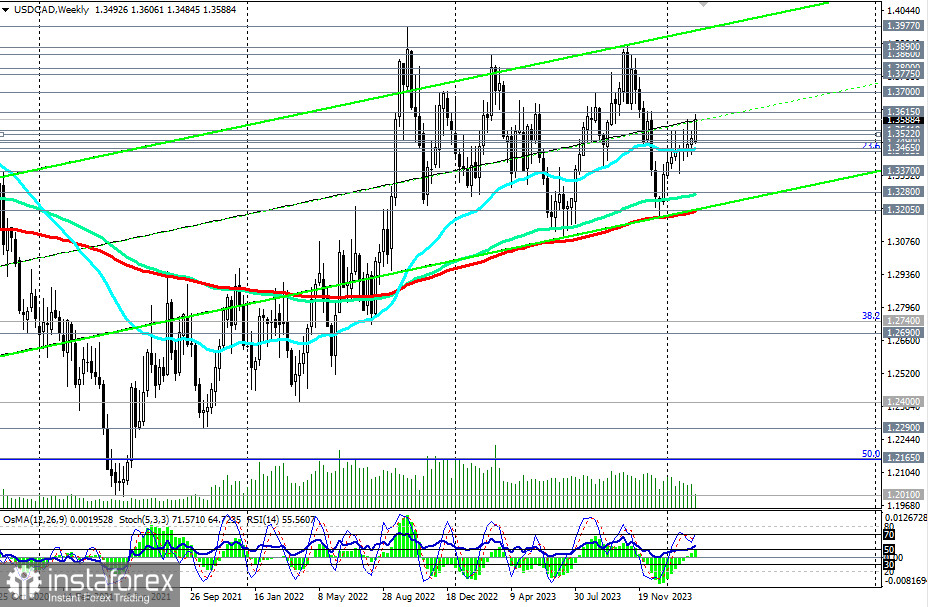
USD/CAD is currently developing positive dynamics within the upward channels on the daily and weekly charts after rebounding from the zone of key support levels at 1.3490 (200 EMA, 50 EMA on the daily chart), 1.3500 (144 EMA on the daily chart), and overcoming the resistance level of 1.3540 yesterday. The price seems to have finally broken out of the range formed between the levels 1.3450 and 1.3540, in which USD/CAD has been trading since mid-January.
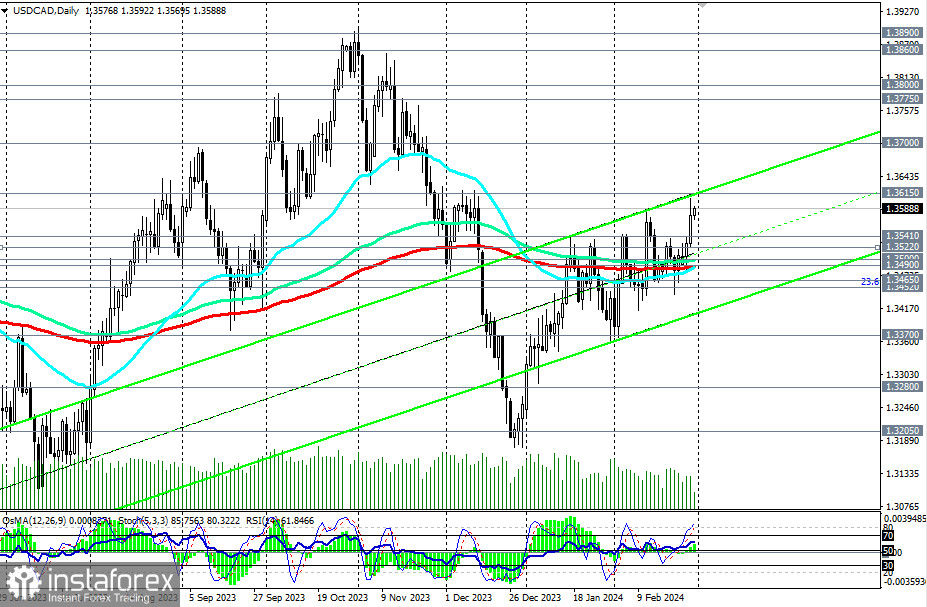
A breakthrough of the next local resistance level at 1.3615 will confirm the bulls' intention to push the pair towards the upper boundary of the upward channel on the weekly chart and the highs of October–November of the previous year, near the 1.3900 mark.
Intermediate targets, in this case, will be located near the levels 1.3700, 1.3780, 1.3800, and 1.3860.
In an alternative scenario, a decline within the aforementioned upward channels and towards key supports at levels 1.3500, 1.3490 will resume.
A breakthrough of these levels and the important support level at 1.3452 (23.6% Fibonacci retracement level in the growth wave from the level of 0.9700 to the level of 1.4600, reached in June 2016) will bring USD/CAD back into the medium-term bearish market zone.
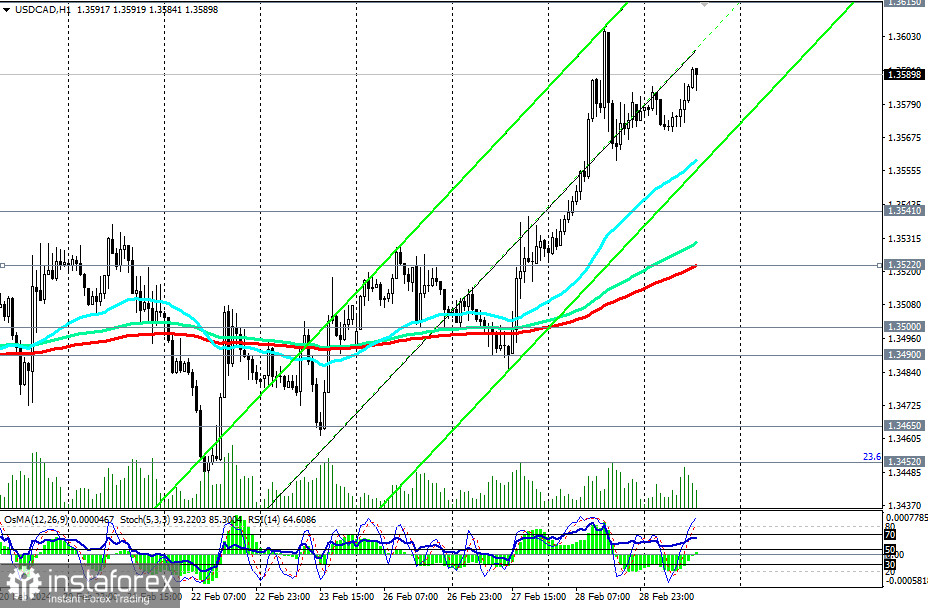
The first signal for the implementation of this scenario could be a breakthrough of today's low at 1.3570.
Increased volatility in the USD/CAD pair can be expected at 13:30 GMT.
Support levels: 1.3570, 1.3540, 1.3522, 1.3500, 1.3490, 1.3465, 1.3452, 1.3400, 1.3370, 1.3300, 1.3280, 1.3200
Resistance levels: 1.3600, 1.3615, 1.3700, 1.3775, 1.3800, 1.3860, 1.3890, 1.3900, 1.3970, 1.4000
Trading Scenarios:
Main Scenario: Buy at the market, Buy Stop at 1.3620. Stop-Loss at 1.3560. Targets at 1.3700, 1.3775, 1.3800, 1.3860, 1.3890, 1.3900, 1.3970, 1.4000.
Alternative Scenario: Sell Stop at 1.3560. Stop-Loss at 1.3620. Targets at 1.3540, 1.3522, 1.3500, 1.3490, 1.3465, 1.3452, 1.3400, 1.3370, 1.3300, 1.3280, 1.3200.
"Targets" correspond to support/resistance levels. This also does not imply that they will necessarily be reached but can serve as a guide in planning and placing trading positions.
*El análisis de mercado publicado aquí tiene la finalidad de incrementar su conocimiento, más no darle instrucciones para realizar una operación.
¡Los informes analíticos de InstaSpot lo mantendrá bien informado de las tendencias del mercado! Al ser un cliente de InstaSpot, se le proporciona una gran cantidad de servicios gratuitos para una operación eficiente.


