


Kumpulan kami mempunyai lebih daripada 7,000,000 pedagang!
Setiap hari kami bekerjasama untuk meningkatkan perdagangan. Kami mendapat keputusan yang tinggi dan bergerak ke hadapan.
Pengiktirafan oleh berjuta-juta pedagang di seluruh dunia adalah penghargaan terbaik untuk kerja kami! Anda membuat pilihan anda dan kami akan melakukan segalanya yang diperlukan untuk memenuhi jangkaan anda!
Kami adalah kumpulan yang terbaik bersama!
InstaSpot. Berbangga bekerja untuk anda!


Pelakon, juara kejohanan UFC 6 dan seorang wira sebenar!
Lelaki yang membuat dirinya sendiri. Lelaki yang mengikut cara kami.
Rahsia di sebalik kejayaan Taktarov adalah pergerakan berterusan ke arah matlamat.
Dedahkan semua segi bakat anda!
Cari, cuba, gagal - tetapi tidak pernah berhenti!
InstaSpot. Kisah kejayaan anda bermula di sini!

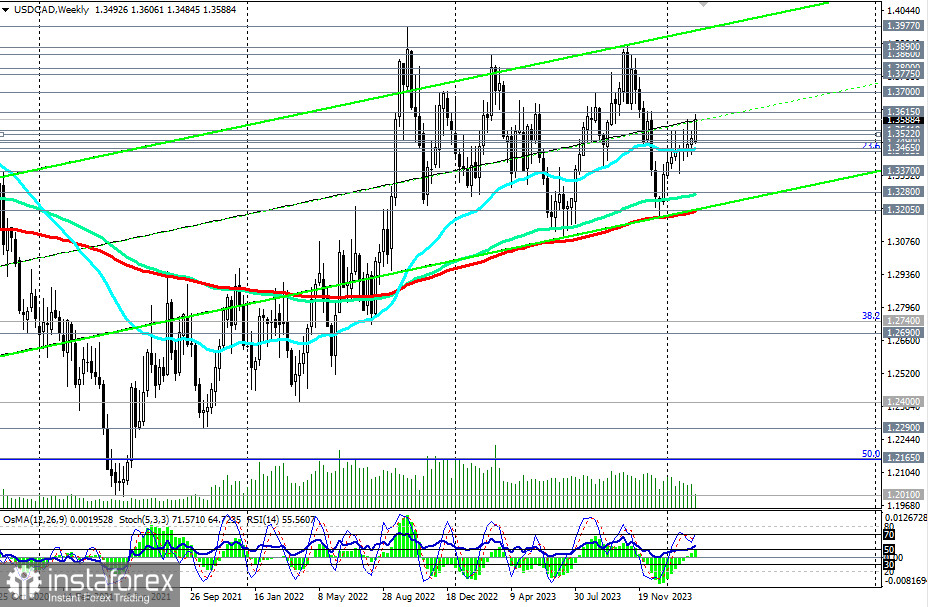
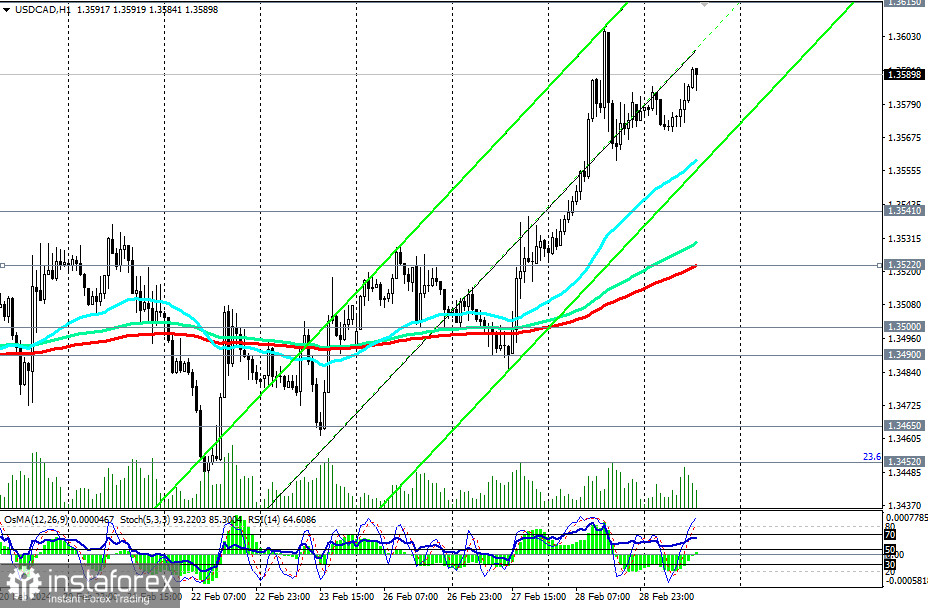
USD/CAD is currently developing positive dynamics within the upward channels on the daily and weekly charts after rebounding from the zone of key support levels at 1.3490 (200 EMA, 50 EMA on the daily chart), 1.3500 (144 EMA on the daily chart), and overcoming the resistance level of 1.3540 yesterday. The price seems to have finally broken out of the range formed between the levels 1.3450 and 1.3540, in which USD/CAD has been trading since mid-January.
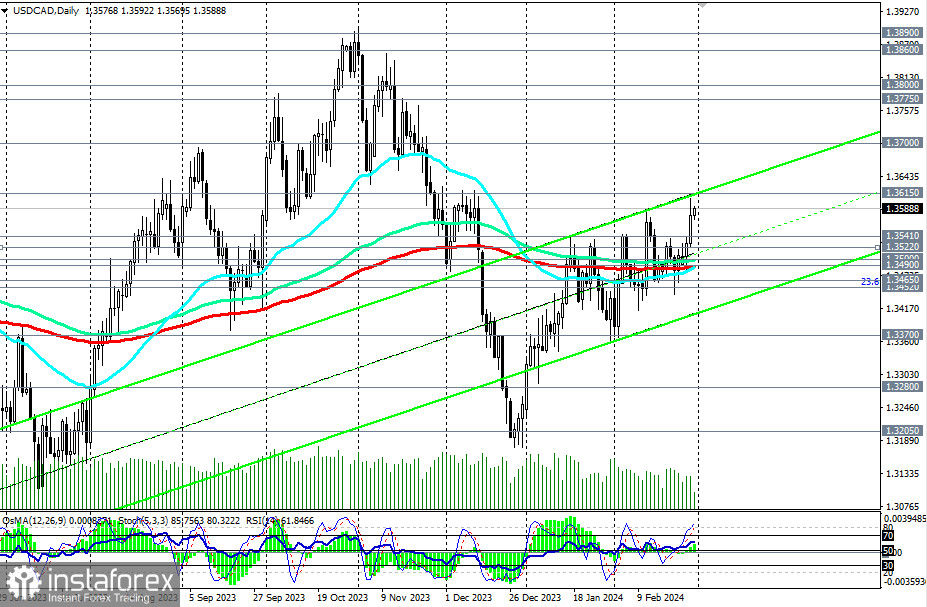
A breakthrough of the next local resistance level at 1.3615 will confirm the bulls' intention to push the pair towards the upper boundary of the upward channel on the weekly chart and the highs of October–November of the previous year, near the 1.3900 mark.
Intermediate targets, in this case, will be located near the levels 1.3700, 1.3780, 1.3800, and 1.3860.
In an alternative scenario, a decline within the aforementioned upward channels and towards key supports at levels 1.3500, 1.3490 will resume.
A breakthrough of these levels and the important support level at 1.3452 (23.6% Fibonacci retracement level in the growth wave from the level of 0.9700 to the level of 1.4600, reached in June 2016) will bring USD/CAD back into the medium-term bearish market zone.
The first signal for the implementation of this scenario could be a breakthrough of today's low at 1.3570.
Increased volatility in the USD/CAD pair can be expected at 13:30 GMT.
Support levels: 1.3570, 1.3540, 1.3522, 1.3500, 1.3490, 1.3465, 1.3452, 1.3400, 1.3370, 1.3300, 1.3280, 1.3200
Resistance levels: 1.3600, 1.3615, 1.3700, 1.3775, 1.3800, 1.3860, 1.3890, 1.3900, 1.3970, 1.4000
Trading Scenarios:
Main Scenario: Buy at the market, Buy Stop at 1.3620. Stop-Loss at 1.3560. Targets at 1.3700, 1.3775, 1.3800, 1.3860, 1.3890, 1.3900, 1.3970, 1.4000.
Alternative Scenario: Sell Stop at 1.3560. Stop-Loss at 1.3620. Targets at 1.3540, 1.3522, 1.3500, 1.3490, 1.3465, 1.3452, 1.3400, 1.3370, 1.3300, 1.3280, 1.3200.
"Targets" correspond to support/resistance levels. This also does not imply that they will necessarily be reached but can serve as a guide in planning and placing trading positions.
* Analisis pasaran yang disiarkan di sini adalah bertujuan untuk meningkatkan kesedaran anda, tetapi tidak untuk memberi arahan untuk membuat perdagangan.
Kajian analisis InstaSpot akan membuat anda mengetahui sepenuhnya aliran pasaran! Sebagai pelanggan InstaSpot, anda disediakan sejumlah besar perkhidmatan percuma untuk dagangan yang cekap.


