


La leggenda nel team InstaSpot!!
Legenda! Pensi che sia troppo patetico? Ma come dobbiamo chiamare un uomo, che è diventato il primo dell'Asia a vincere il campionato mondiale di scacchi a 18 anni e che è diventato il primo Gran Maestro indiano a 19? Fu l'inizio di un duro cammino verso il titolo di campione del mondo, l'uomo che divenne per sempre una parte della storia di scacchi. Un'altra leggenda nel team InstaSpot!


Il Borussia è una delle squadre di calcio più titolate in Germania, che ha ripetutamente dimostrato ai tifosi che lo spirito di competizione e leadership porta al successo. Fai trading nello stesso modo in cui lo fanno i professionisti dello sport - fiduciosamente e attivamente. Segui il Borussia FC e sii avanti con InstaSpot!

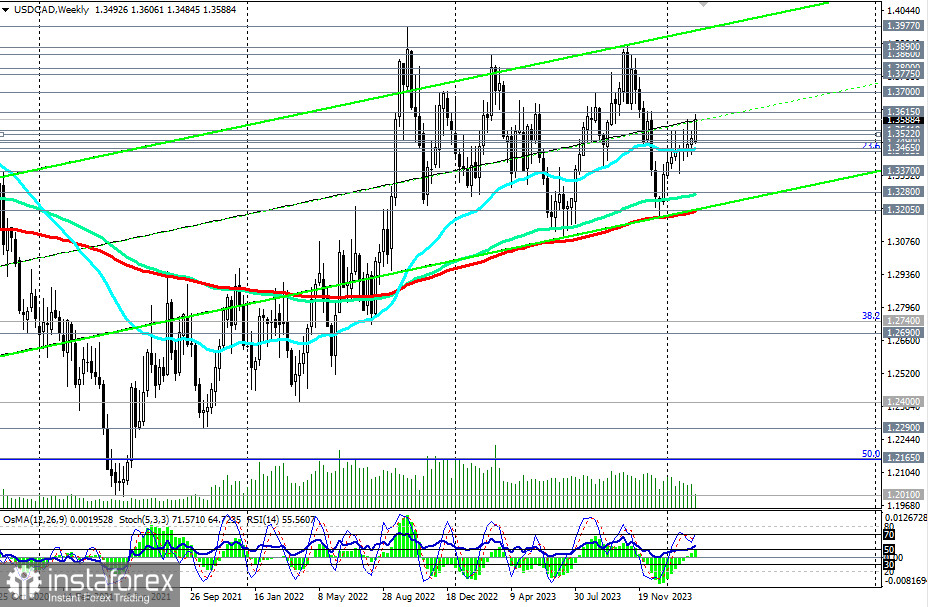
USD/CAD is currently developing positive dynamics within the upward channels on the daily and weekly charts after rebounding from the zone of key support levels at 1.3490 (200 EMA, 50 EMA on the daily chart), 1.3500 (144 EMA on the daily chart), and overcoming the resistance level of 1.3540 yesterday. The price seems to have finally broken out of the range formed between the levels 1.3450 and 1.3540, in which USD/CAD has been trading since mid-January.
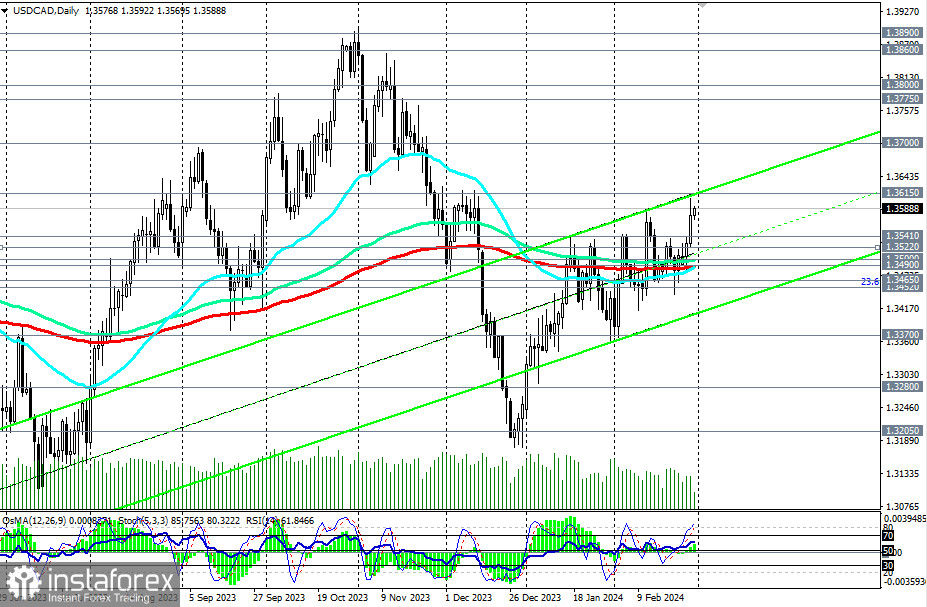
A breakthrough of the next local resistance level at 1.3615 will confirm the bulls' intention to push the pair towards the upper boundary of the upward channel on the weekly chart and the highs of October–November of the previous year, near the 1.3900 mark.
Intermediate targets, in this case, will be located near the levels 1.3700, 1.3780, 1.3800, and 1.3860.
In an alternative scenario, a decline within the aforementioned upward channels and towards key supports at levels 1.3500, 1.3490 will resume.
A breakthrough of these levels and the important support level at 1.3452 (23.6% Fibonacci retracement level in the growth wave from the level of 0.9700 to the level of 1.4600, reached in June 2016) will bring USD/CAD back into the medium-term bearish market zone.
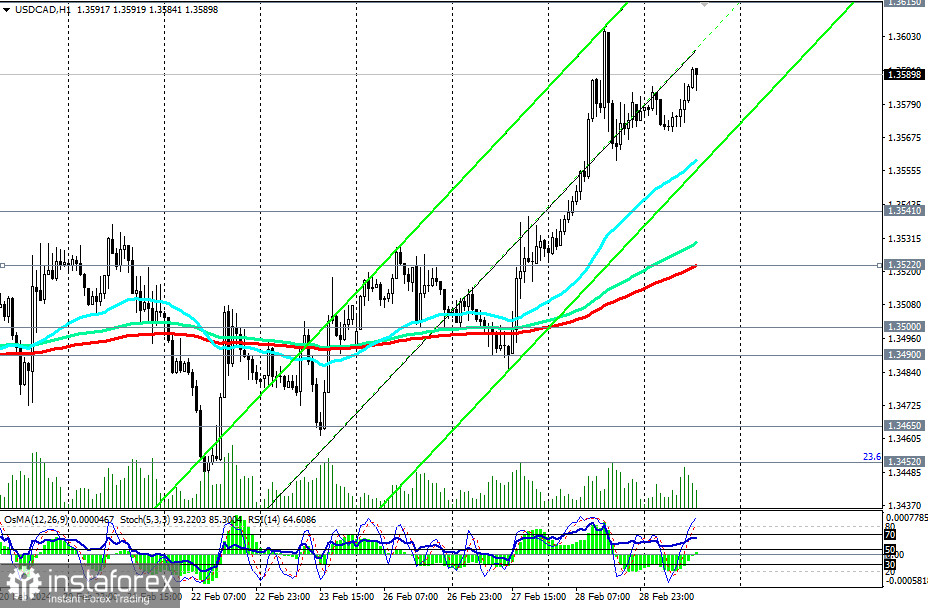
The first signal for the implementation of this scenario could be a breakthrough of today's low at 1.3570.
Increased volatility in the USD/CAD pair can be expected at 13:30 GMT.
Support levels: 1.3570, 1.3540, 1.3522, 1.3500, 1.3490, 1.3465, 1.3452, 1.3400, 1.3370, 1.3300, 1.3280, 1.3200
Resistance levels: 1.3600, 1.3615, 1.3700, 1.3775, 1.3800, 1.3860, 1.3890, 1.3900, 1.3970, 1.4000
Trading Scenarios:
Main Scenario: Buy at the market, Buy Stop at 1.3620. Stop-Loss at 1.3560. Targets at 1.3700, 1.3775, 1.3800, 1.3860, 1.3890, 1.3900, 1.3970, 1.4000.
Alternative Scenario: Sell Stop at 1.3560. Stop-Loss at 1.3620. Targets at 1.3540, 1.3522, 1.3500, 1.3490, 1.3465, 1.3452, 1.3400, 1.3370, 1.3300, 1.3280, 1.3200.
"Targets" correspond to support/resistance levels. This also does not imply that they will necessarily be reached but can serve as a guide in planning and placing trading positions.
*La presente analisi del mercato ha un carattere esclusivamente informativo e non rappresenta una guida per l`effettuazione di una transazione.
Le recensioni analitiche di InstaSpot ti renderanno pienamente consapevole delle tendenze del mercato! Essendo un cliente InstaSpot, ti viene fornito un gran numero di servizi gratuiti per il trading efficiente.


