


¡Nuestro equipo cuenta con más de 7,000,000 operadores!
Cada día, trabajamos juntos para mejorar las operaciones. Obtenemos grandes resultados y seguimos adelante.
El reconocimiento de millones de operadores en todo el mundo es el mejor agradecimiento a nuestro trabajo! ¡Usted hizo su elección y haremos todo lo que esté a nuestro alcance para satisfacer sus expectativas!
¡Juntos somos un gran equipo!
InstaSpot. ¡Orgulloso de trabajar para usted!


¡Actor, 6 veces ganador del torneo UFC y un verdadero héroe!
El hombre que se hizo a sí mismo. El hombre que sigue nuestro camino.
El secreto detrás del éxito de Taktarov es el constante movimiento hacia el objetivo.
¡Revele todo los lados de su talento!
Descubra, intente, fracase, ¡pero nunca se rinda!
InstaSpot. ¡Su historia de éxito comienza aquí!
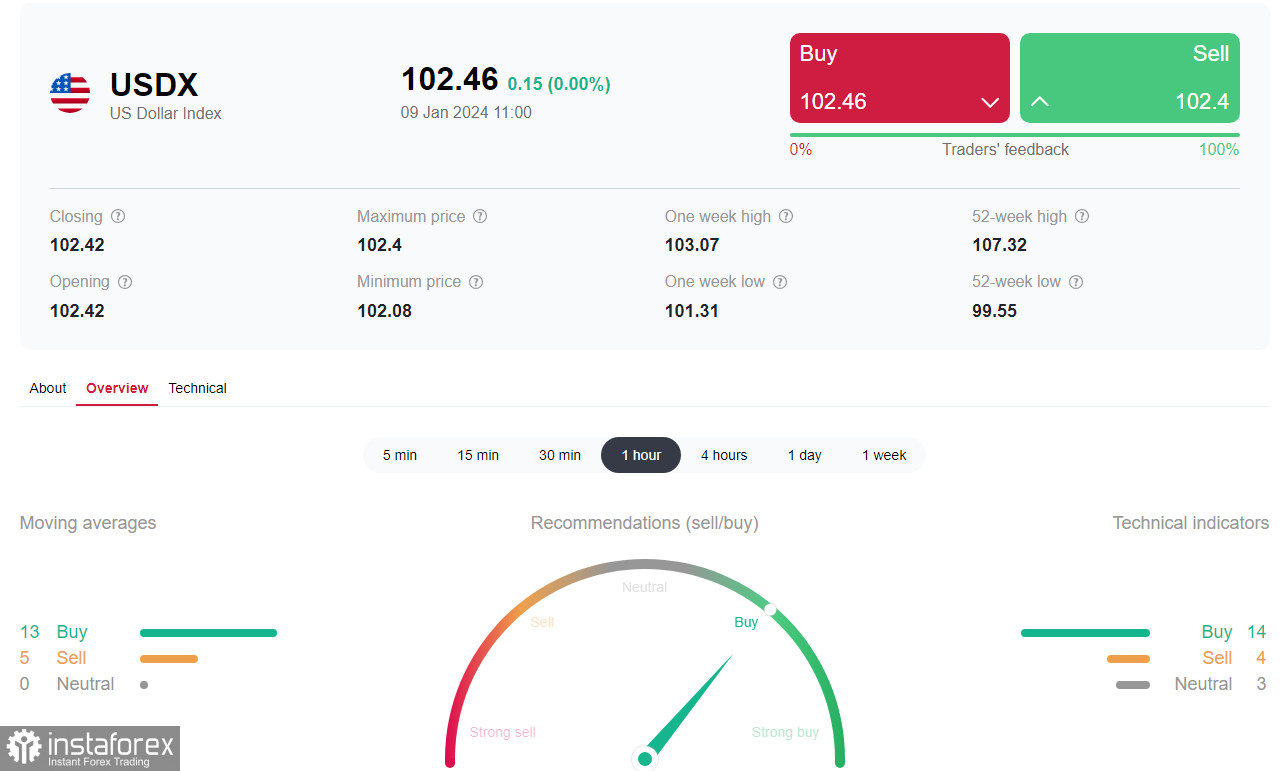
The dollar remains stable ahead of the key publications on Thursday, although the growth of its DXY index has also paused near the levels of 102.00, 102.10. The sluggish dynamics in the currency market and range-bound trading may continue until these publications on Thursday.
Clearly, the market and the dollar need new drivers, which could be provided by fresh data on inflation in the USA, to be published on Thursday.
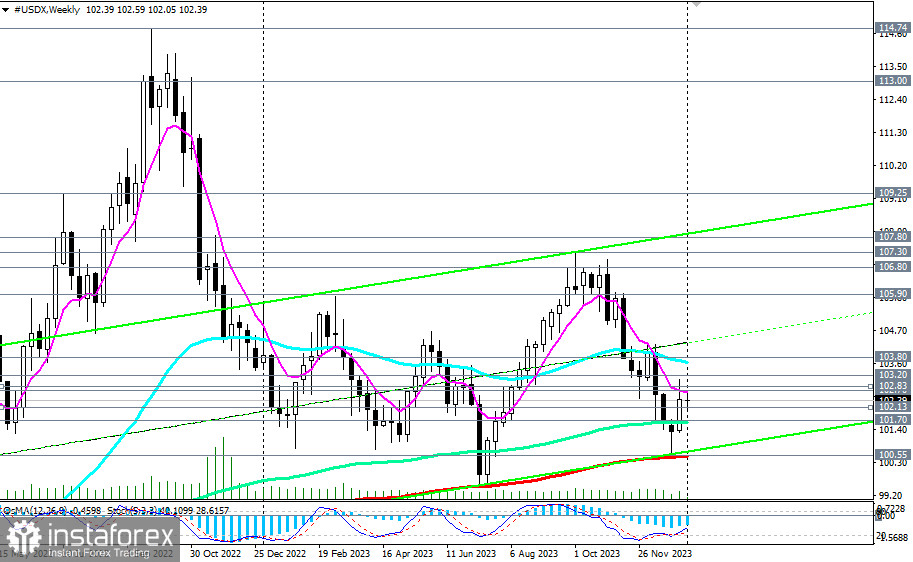
From a technical point of view, the dollar index (CFD #USDX in the MT4 terminal) is trying to revive the long-term upward dynamics, having rebounded at the end of December from the key long-term support level of 100.55 (200 EMA on the weekly chart) and breaking into the zone above the important long-term support level of 101.70 (144 EMA on the weekly chart).
The breakout of the recent local high of 102.70 and the important short-term resistance level of 102.83 (200 EMA on the 4-hour chart) may signal the accumulation of long positions on the dollar index and CFD #USDX.
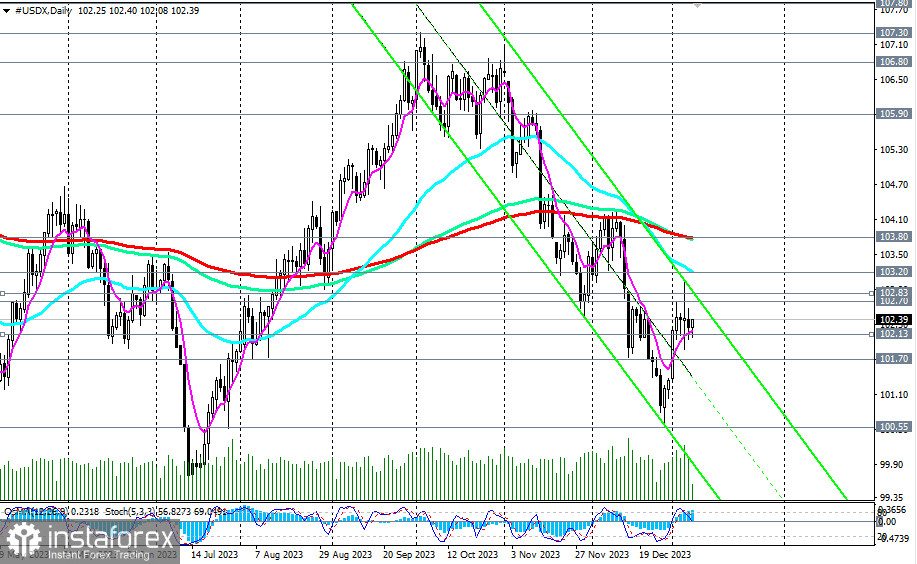
In case of further growth, the breakout of the key medium-term resistance level of 103.80 (200 EMA, 144 EMA on the daily chart) will confirm the entry of the dollar index into the medium-term bull market zone.
An alternative scenario will be associated with the breakdown of the key long-term support level of 100.55. Further decline and break below the 100.00 mark will move DXY into the zone of a long-term bear market, making long-term short positions preferable from a technical point of view.
The earliest signal for the start of implementing this scenario may be the breakdown of the short-term support level of 102.13 (200 EMA on the 1-hour chart) and the 102.00 mark, and the breakdown of the important support level of 101.70 as confirmation.

Support levels: 102.13, 102.00, 101.70, 101.00, 100.55, 100.00
Resistance levels: 102.70, 102.83, 103.00, 103.20, 103.80, 104.00
Trading Scenarios
Main scenario: Buy at market, Buy Stop 102.85. Stop-Loss 101.90. Targets 103.00, 103.30, 103.70, 103.85, 104.00, 105.00, 105.98, 106.00, 106.80, 107.00, 107.09, 107.32, 107.80, 108.00, 109.00, 109.25
Alternative scenario: Sell Stop 101.90. Stop-Loss 102.50. Targets 101.70, 101.00, 100.55, 100.00
'Targets' correspond to support/resistance levels. This does not mean that they will necessarily be reached, but can serve as a guide when planning and placing your trading positions.
*El análisis de mercado publicado aquí tiene la finalidad de incrementar su conocimiento, más no darle instrucciones para realizar una operación.
¡Los informes analíticos de InstaSpot lo mantendrá bien informado de las tendencias del mercado! Al ser un cliente de InstaSpot, se le proporciona una gran cantidad de servicios gratuitos para una operación eficiente.


