


الأسطورة فى فريق إنستافوركس!
الأسطورة! هل تعتقد أن هذا هو الخطاب المنمق؟ ولكن كيف ينبغي أن نطلق على الرجل، الذي أصبح أول آسيوي يفوز ببطولة العالم للشطرنج للشباب بعمر 18 سنة والذي أصبح أول أستاذ كبير هندي في سن 19؟ وكانت هذه بداية طريق صعب إلى لقب بطل العالم لـ فيسواناثان أناند، الرجل الذي أصبح جزءًا من تاريخ الشطرنج إلى الأبد. والآن أسطورة آخر في فريق إنستافوركس!


يعتبر بوروسيا دورتموند أحد أكثر أندية كرة القدم حصولاً على الألقاب في ألمانيا، وقد أثبت ذلك مرارًا وتكرارًا للجماهير: فإنّ روح المنافسة والقيادة ستؤدي بالتأكيد إلى النجاح. قم بالتداول بنفس الطريقة التي يلعب بها المحترفون الرياضيون اللعبة: بثقة ونشاط. احتفظ بـ "ترخيص دخول" من نادي بوروسيا دورتموند لكرة القدم وكن في الصدارة مع إنستافوركس!
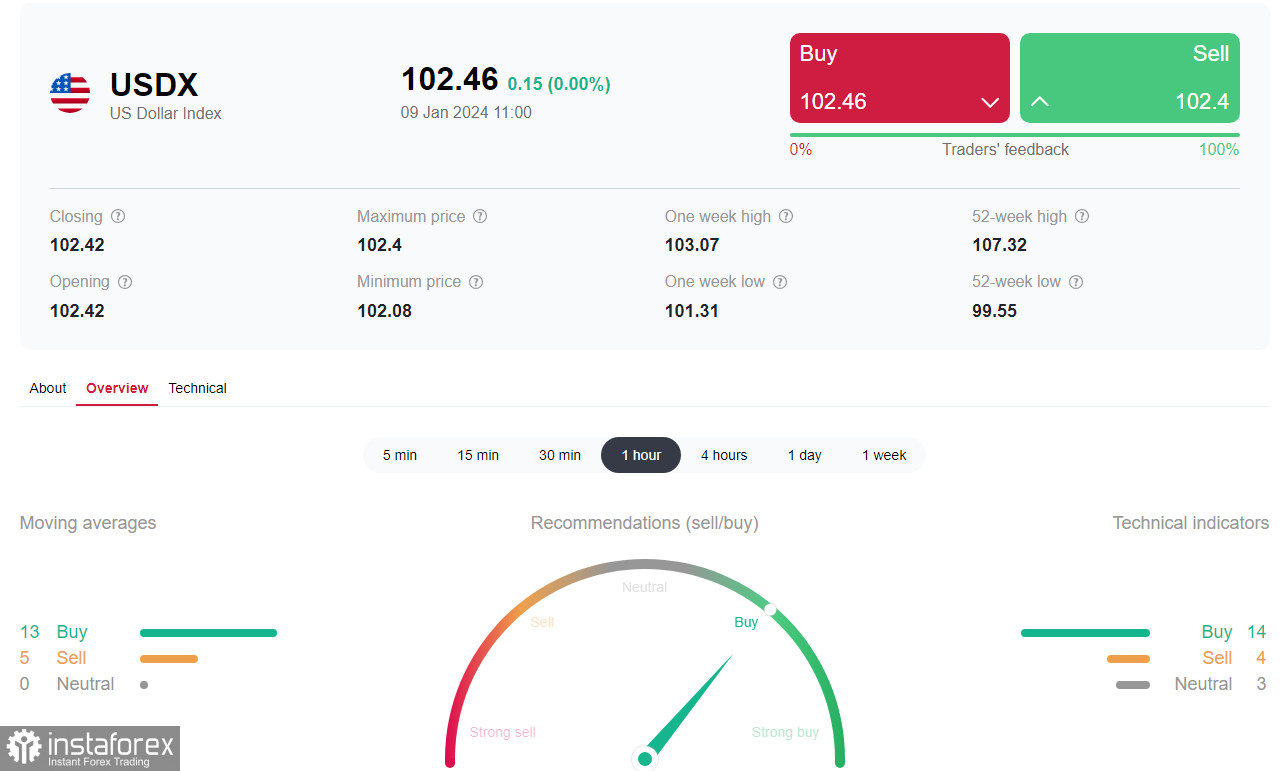
The dollar remains stable ahead of the key publications on Thursday, although the growth of its DXY index has also paused near the levels of 102.00, 102.10. The sluggish dynamics in the currency market and range-bound trading may continue until these publications on Thursday.
Clearly, the market and the dollar need new drivers, which could be provided by fresh data on inflation in the USA, to be published on Thursday.
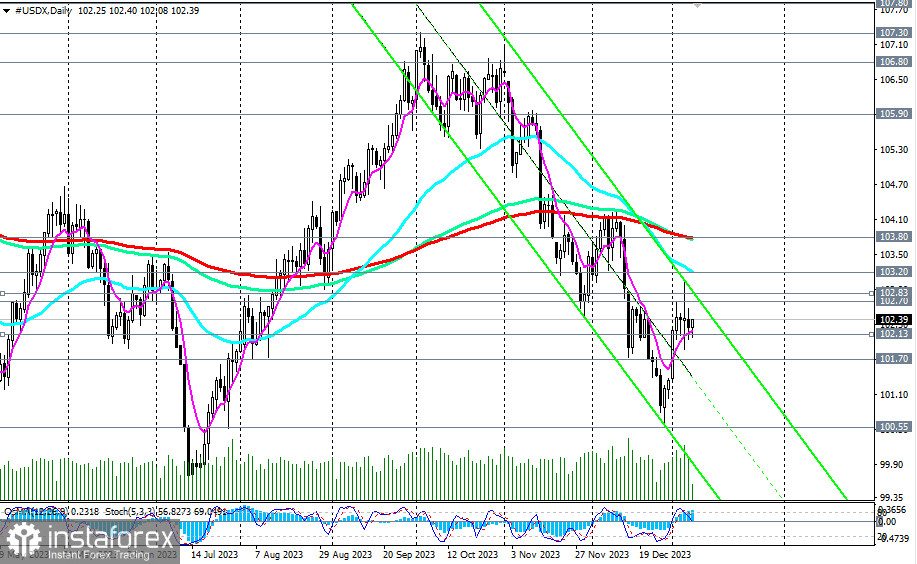
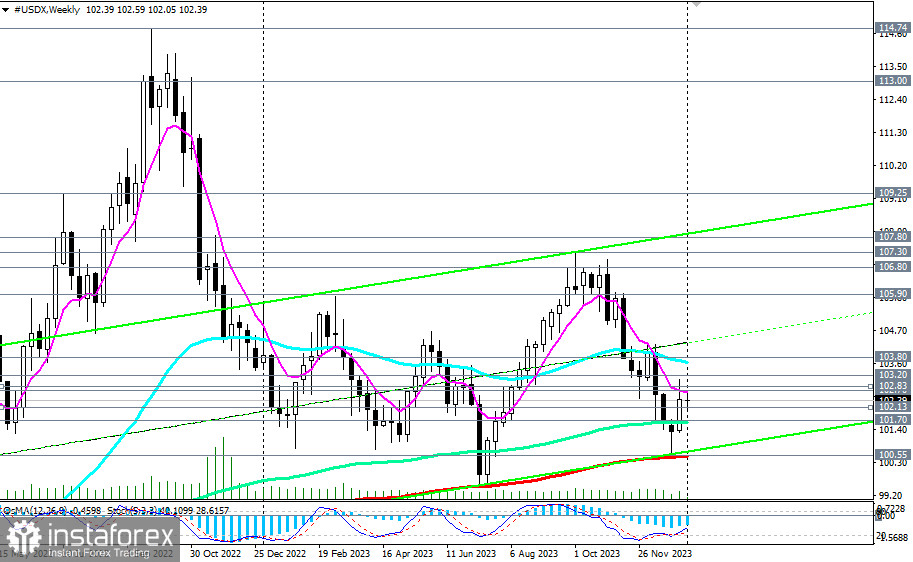
From a technical point of view, the dollar index (CFD #USDX in the MT4 terminal) is trying to revive the long-term upward dynamics, having rebounded at the end of December from the key long-term support level of 100.55 (200 EMA on the weekly chart) and breaking into the zone above the important long-term support level of 101.70 (144 EMA on the weekly chart).
The breakout of the recent local high of 102.70 and the important short-term resistance level of 102.83 (200 EMA on the 4-hour chart) may signal the accumulation of long positions on the dollar index and CFD #USDX.
In case of further growth, the breakout of the key medium-term resistance level of 103.80 (200 EMA, 144 EMA on the daily chart) will confirm the entry of the dollar index into the medium-term bull market zone.
An alternative scenario will be associated with the breakdown of the key long-term support level of 100.55. Further decline and break below the 100.00 mark will move DXY into the zone of a long-term bear market, making long-term short positions preferable from a technical point of view.
The earliest signal for the start of implementing this scenario may be the breakdown of the short-term support level of 102.13 (200 EMA on the 1-hour chart) and the 102.00 mark, and the breakdown of the important support level of 101.70 as confirmation.

Support levels: 102.13, 102.00, 101.70, 101.00, 100.55, 100.00
Resistance levels: 102.70, 102.83, 103.00, 103.20, 103.80, 104.00
Trading Scenarios
Main scenario: Buy at market, Buy Stop 102.85. Stop-Loss 101.90. Targets 103.00, 103.30, 103.70, 103.85, 104.00, 105.00, 105.98, 106.00, 106.80, 107.00, 107.09, 107.32, 107.80, 108.00, 109.00, 109.25
Alternative scenario: Sell Stop 101.90. Stop-Loss 102.50. Targets 101.70, 101.00, 100.55, 100.00
'Targets' correspond to support/resistance levels. This does not mean that they will necessarily be reached, but can serve as a guide when planning and placing your trading positions.
*The market analysis posted here is meant to increase your awareness, but not to give instructions to make a trade.
InstaSpot analytical reviews will make you fully aware of market trends! Being an InstaSpot client, you are provided with a large number of free services for efficient trading.


