


The legend in the InstaSpot team!
Legend! You think that's bombastic rhetoric? But how should we call a man, who became the first Asian to win the junior world chess championship at 18 and who became the first Indian Grandmaster at 19? That was the start of a hard path to the World Champion title for Viswanathan Anand, the man who became a part of history of chess forever. Now one more legend in the InstaSpot team!


Borussia is one of the most titled football clubs in Germany, which has repeatedly proved to fans: the spirit of competition and leadership will certainly lead to success. Trade in the same way that sports professionals play the game: confidently and actively. Keep a "pass" from Borussia FC and be in the lead with InstaSpot!
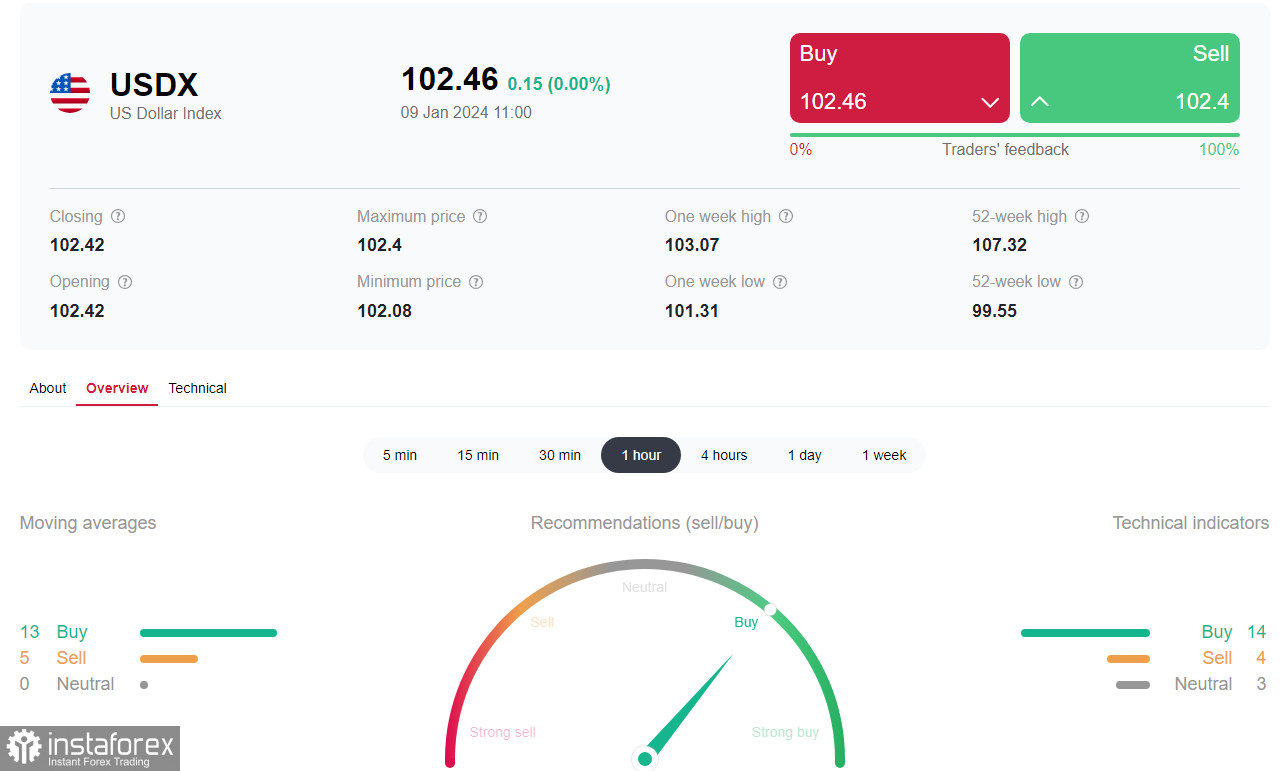
The dollar remains stable ahead of the key publications on Thursday, although the growth of its DXY index has also paused near the levels of 102.00, 102.10. The sluggish dynamics in the currency market and range-bound trading may continue until these publications on Thursday.
Clearly, the market and the dollar need new drivers, which could be provided by fresh data on inflation in the USA, to be published on Thursday.
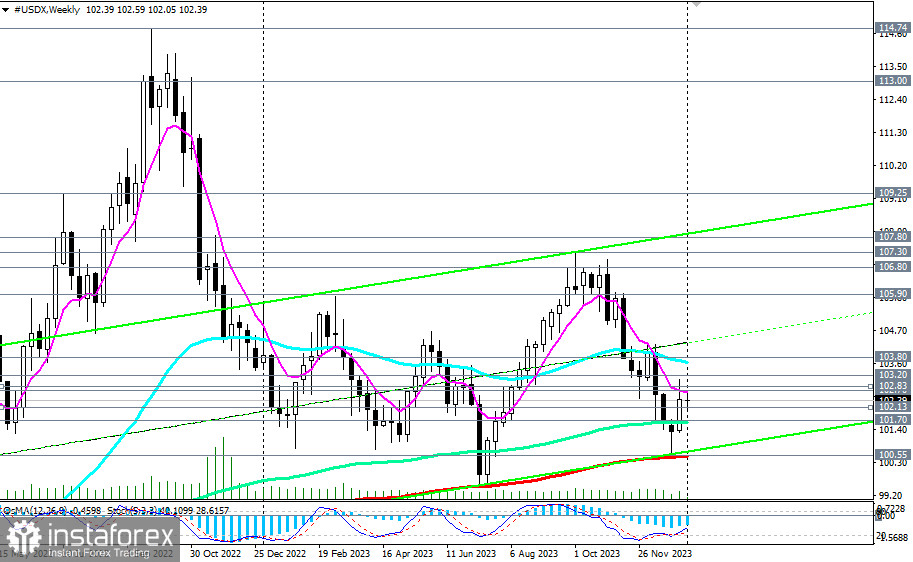
From a technical point of view, the dollar index (CFD #USDX in the MT4 terminal) is trying to revive the long-term upward dynamics, having rebounded at the end of December from the key long-term support level of 100.55 (200 EMA on the weekly chart) and breaking into the zone above the important long-term support level of 101.70 (144 EMA on the weekly chart).
The breakout of the recent local high of 102.70 and the important short-term resistance level of 102.83 (200 EMA on the 4-hour chart) may signal the accumulation of long positions on the dollar index and CFD #USDX.
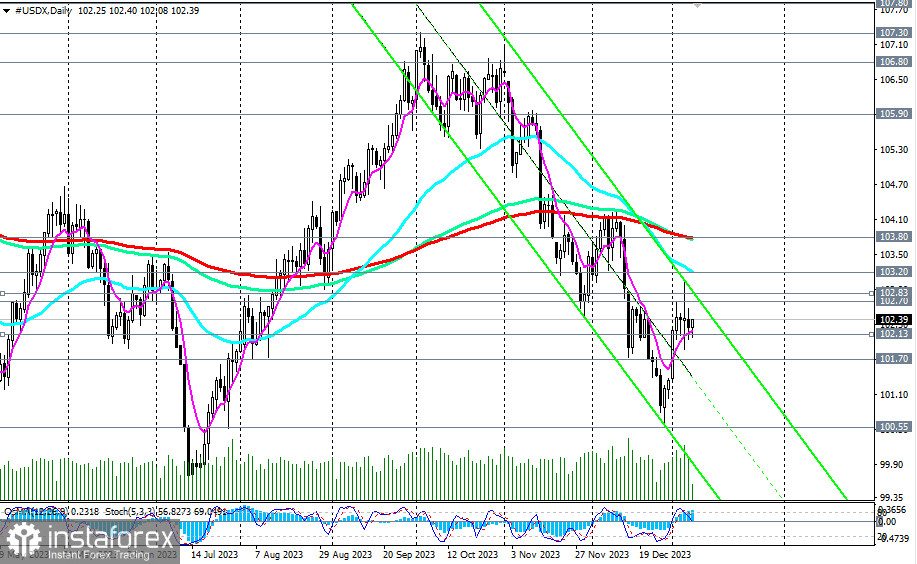
In case of further growth, the breakout of the key medium-term resistance level of 103.80 (200 EMA, 144 EMA on the daily chart) will confirm the entry of the dollar index into the medium-term bull market zone.
An alternative scenario will be associated with the breakdown of the key long-term support level of 100.55. Further decline and break below the 100.00 mark will move DXY into the zone of a long-term bear market, making long-term short positions preferable from a technical point of view.
The earliest signal for the start of implementing this scenario may be the breakdown of the short-term support level of 102.13 (200 EMA on the 1-hour chart) and the 102.00 mark, and the breakdown of the important support level of 101.70 as confirmation.

Support levels: 102.13, 102.00, 101.70, 101.00, 100.55, 100.00
Resistance levels: 102.70, 102.83, 103.00, 103.20, 103.80, 104.00
Trading Scenarios
Main scenario: Buy at market, Buy Stop 102.85. Stop-Loss 101.90. Targets 103.00, 103.30, 103.70, 103.85, 104.00, 105.00, 105.98, 106.00, 106.80, 107.00, 107.09, 107.32, 107.80, 108.00, 109.00, 109.25
Alternative scenario: Sell Stop 101.90. Stop-Loss 102.50. Targets 101.70, 101.00, 100.55, 100.00
'Targets' correspond to support/resistance levels. This does not mean that they will necessarily be reached, but can serve as a guide when planning and placing your trading positions.
*这里的市场分析是为了增加您对市场的了解,而不是给出交易的指示。
InstaSpot分析评论将让您充分了解市场趋势! 作为InstaSpot的客户,您将获得大量的免费服务以实现有效的交易。


