


¡La leyenda en el equipo de InstaSpot!
¡Leyenda! ¿Cree que es una retórica grandilocuente? Pero, ¿cómo deberíamos llamar a un hombre, que se convirtió en el primer asiático en ganar el campeonato mundial de ajedrez júnior a los 18 años y en el primer Gran Maestro indio a los 19 años? Ese fue el comienzo de un camino difícil hacia el título de Campeón del Mundo para Viswanathan Anand, el hombre que se convirtió en parte de la historia del ajedrez para siempre. ¡Ahora una leyenda más en el equipo de InstaSpot!


Borussia es uno de los clubes de fútbol con más títulos en Alemania, que ha demostrado repetidamente a los fanáticos: el espíritu de competencia y liderazgo que ciertamente conducirán al éxito. Opere de la misma manera que los profesionales del deporte: con confianza y de forma activa. ¡Mantenga un "pase" del Borussia FC y lidere con InstaSpot!
Trend analysis (Fig. 1)
On Wednesday, from the level of 1.1041 (closing of yesterday's daily candle), EUR/USD will rise and test the historical resistance level of 1.1063 (blue dashed line). After that, it may continue moving upward to the 76.4% retracement level of 1.1080 (blue dashed line).
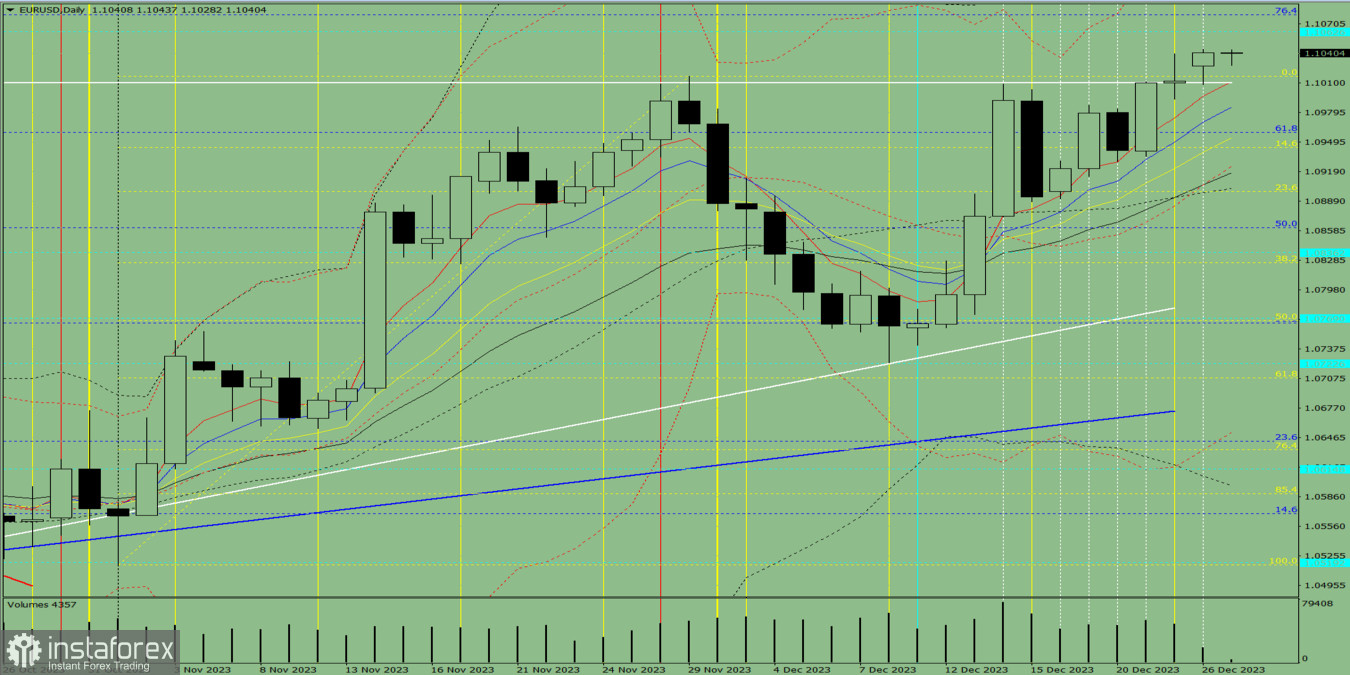
Fig. 1 (daily chart)
Comprehensive analysis:
Fibonacci levels - uptrend
Indicator analysis - uptrend
Volume - uptrend
Candlestick analysis - uptrend
Trend analysis - uptrend
Bollinger bands - uptrend
Weekly chart - uptrend
Conclusion: Moving upwards from the level of 1.1041 (closing of yesterday's daily candle), EUR/USD will test the historical resistance level of 1.1063 (blue dashed line), and then head to the 76.4% retracement level of 1.1080 (blue dashed line).
Alternatively, it could climb from the level of 1.1041 (closing of yesterday's daily candle) to the historical resistance level of 1.1063 (blue dashed line), followed by a decline to the upper fractal at 1.1040 (daily candle from December 22, 2023).
*El análisis de mercado publicado aquí tiene la finalidad de incrementar su conocimiento, más no darle instrucciones para realizar una operación.
¡Los informes analíticos de InstaSpot lo mantendrá bien informado de las tendencias del mercado! Al ser un cliente de InstaSpot, se le proporciona una gran cantidad de servicios gratuitos para una operación eficiente.


