


Our team has over 7,000,000 traders!
Every day we work together to improve trading. We get high results and move forward.
Recognition by millions of traders all over the world is the best appreciation of our work! You made your choice and we will do everything it takes to meet your expectations!
We are a great team together!
InstaSpot. Proud to work for you!


Actor, UFC 6 tournament champion and a true hero!
The man who made himself. The man that goes our way.
The secret behind Taktarov's success is constant movement towards the goal.
Reveal all the sides of your talent!
Discover, try, fail - but never stop!
InstaSpot. Your success story starts here!

Trend analysis (Fig. 1)
On Wednesday, from the level of 1.1041 (closing of yesterday's daily candle), EUR/USD will rise and test the historical resistance level of 1.1063 (blue dashed line). After that, it may continue moving upward to the 76.4% retracement level of 1.1080 (blue dashed line).
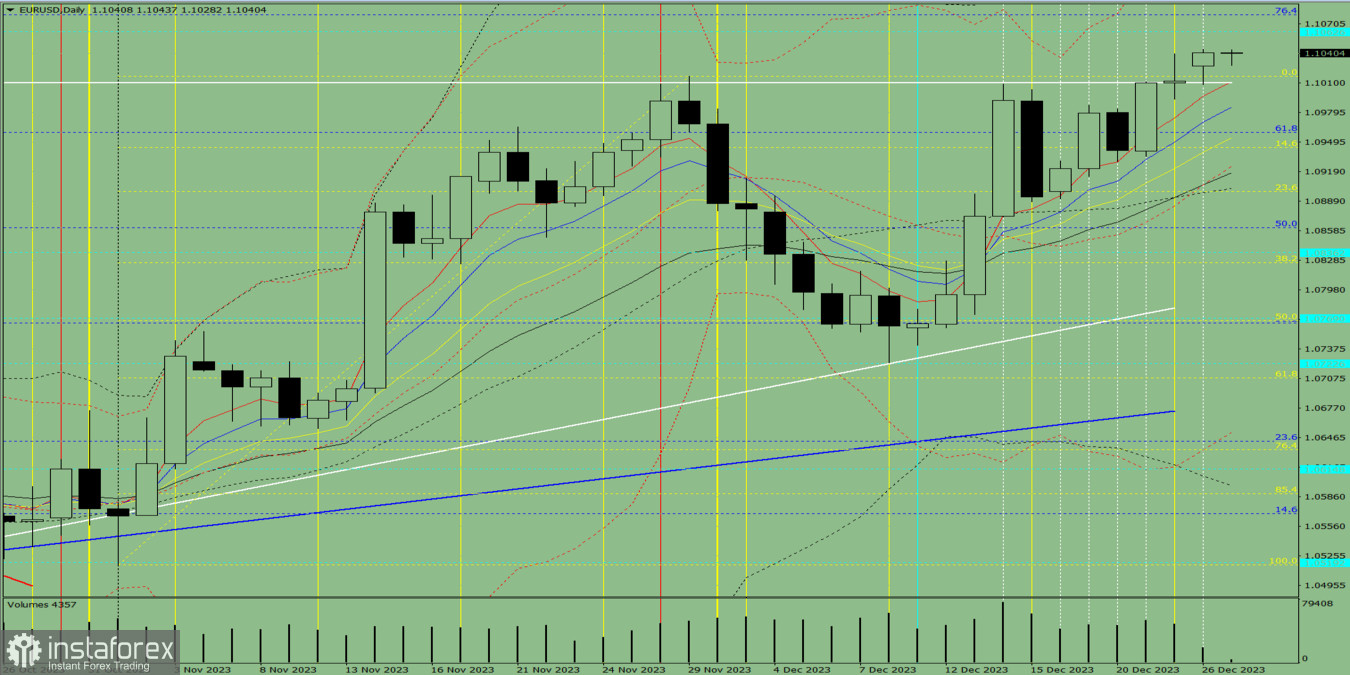
Fig. 1 (daily chart)
Comprehensive analysis:
Fibonacci levels - uptrend
Indicator analysis - uptrend
Volume - uptrend
Candlestick analysis - uptrend
Trend analysis - uptrend
Bollinger bands - uptrend
Weekly chart - uptrend
Conclusion: Moving upwards from the level of 1.1041 (closing of yesterday's daily candle), EUR/USD will test the historical resistance level of 1.1063 (blue dashed line), and then head to the 76.4% retracement level of 1.1080 (blue dashed line).
Alternatively, it could climb from the level of 1.1041 (closing of yesterday's daily candle) to the historical resistance level of 1.1063 (blue dashed line), followed by a decline to the upper fractal at 1.1040 (daily candle from December 22, 2023).
*এখানে পোস্ট করা মার্কেট বিশ্লেষণ আপনার সচেতনতা বৃদ্ধির জন্য প্রদান করা হয়, ট্রেড করার নির্দেশনা প্রদানের জন্য প্রদান করা হয় না।
ইন্সটাফরেক্স বিশ্লেষণমূলক পর্যালোচনাগুলো আপনাকে মার্কেট প্রবণতা সম্পর্কে পুরোপুরি সচেতন করবে! ইন্সটাফরেক্সের একজন গ্রাহক হওয়ায়, দক্ষ ট্রেডিং এর জন্য আপনাকে অনেক সেবা বিনামূল্যে প্রদান করা হয়।


