


ทีมงานของพวกเรา พร้อมกับเทรดเดอร์มากกว่า 7,000,000 คน!
ในทุกวัน พวกเราได้รวมงานร่วมกันเพื่อพัฒนาการเทรด พวกเรามีผลตอบรับที่ดี และยังเดินหน้าต่อไป
การยอมรับจากเทรดเดอร์นับล้านจากทั่วทุกมุมโลกนั้นเป็น ผลงา่นอันน่าประทับใจมากที่สุดของพวกเรา! คุณเลือกตัวเลือก และพวกเราจะจัดการทุกอย่างให้ตรงกับการคาดหวังของคุณ !
พวกเราเป็นทีมงานที่ดีที่สุด!
InstaSpot รู้สึกเป็นเกียรติที่ได้ร่วมงานกับคุณ !


นักแสดง, แชมป์เปี้ยนทัวร์นาเม้น UFC 6 และฮิโรที่แท้จริง !
ชายผู้สามารถก่อร่างสร้างตัวขึ้นมาได้ด้วยตัวเขาเอง ชายผู้ที่นำพาเส้นทางให้พวกเรา
ความลับที่อยู่เบื้องหลังความสำเร็จของ Taktarov ก็คือการมุ่งหน้าไปสู่เป้าหมายแบบทันที
เปิดเผยทุกด้านของความสำเร็จคุณ !
ค้นพบ, พยายาม, ผิดพลาดได้ แต่อย่าพึ่งหยุดยั่ง !
InstaSpot ที่พร้อมจะเป็นจุดเริ่มต้น เรื่องราวความสำเร็จของคุณ !

Trend analysis (Fig. 1)
On Wednesday, from the level of 1.1041 (closing of yesterday's daily candle), EUR/USD will rise and test the historical resistance level of 1.1063 (blue dashed line). After that, it may continue moving upward to the 76.4% retracement level of 1.1080 (blue dashed line).
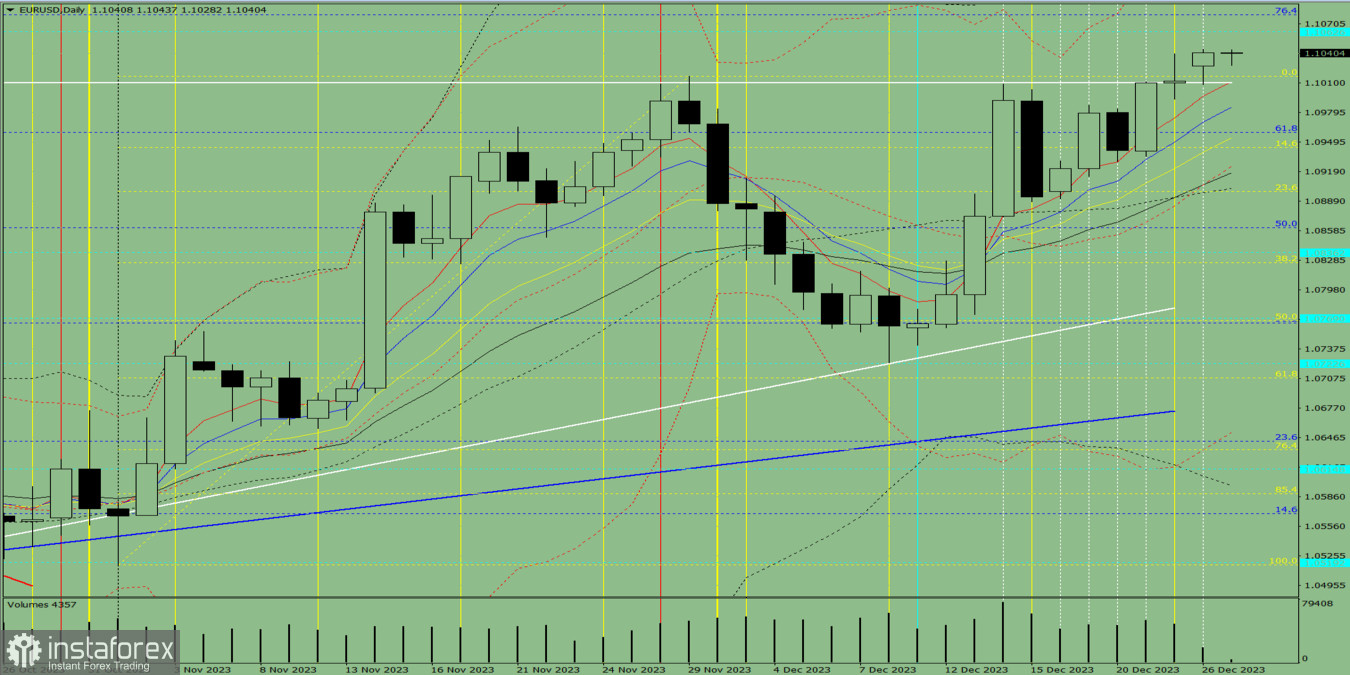
Fig. 1 (daily chart)
Comprehensive analysis:
Fibonacci levels - uptrend
Indicator analysis - uptrend
Volume - uptrend
Candlestick analysis - uptrend
Trend analysis - uptrend
Bollinger bands - uptrend
Weekly chart - uptrend
Conclusion: Moving upwards from the level of 1.1041 (closing of yesterday's daily candle), EUR/USD will test the historical resistance level of 1.1063 (blue dashed line), and then head to the 76.4% retracement level of 1.1080 (blue dashed line).
Alternatively, it could climb from the level of 1.1041 (closing of yesterday's daily candle) to the historical resistance level of 1.1063 (blue dashed line), followed by a decline to the upper fractal at 1.1040 (daily candle from December 22, 2023).
*บทวิเคราะห์ในตลาดที่มีการโพสต์ตรงนี้ เพียงเพื่อทำให้คุณทราบถึงข้อมูล ไม่ได้เป็นการเจาะจงถึงขั้นตอนให้คุณทำการซื้อขายตาม
บทวิเคราะห์ของทาง InstaSpot จะทำให้คุณทราบถึงแนวโน้มของตลาด! ในการที่เป็นลูกค้าของทาง InstaSpot นั้นคุณจะได้รับการบริการเพื่อการซื้อขายอย่างเต็มประสิทธิภาพอย่างมากมาย


