


¡La leyenda en el equipo de InstaSpot!
¡Leyenda! ¿Cree que es una retórica grandilocuente? Pero, ¿cómo deberíamos llamar a un hombre, que se convirtió en el primer asiático en ganar el campeonato mundial de ajedrez júnior a los 18 años y en el primer Gran Maestro indio a los 19 años? Ese fue el comienzo de un camino difícil hacia el título de Campeón del Mundo para Viswanathan Anand, el hombre que se convirtió en parte de la historia del ajedrez para siempre. ¡Ahora una leyenda más en el equipo de InstaSpot!


Borussia es uno de los clubes de fútbol con más títulos en Alemania, que ha demostrado repetidamente a los fanáticos: el espíritu de competencia y liderazgo que ciertamente conducirán al éxito. Opere de la misma manera que los profesionales del deporte: con confianza y de forma activa. ¡Mantenga un "pase" del Borussia FC y lidere con InstaSpot!
On Monday, the final data on the Eurozone Services Business Activity Index were published, along with the Composite Business Activity Index, which both completely matched the preliminary estimates.
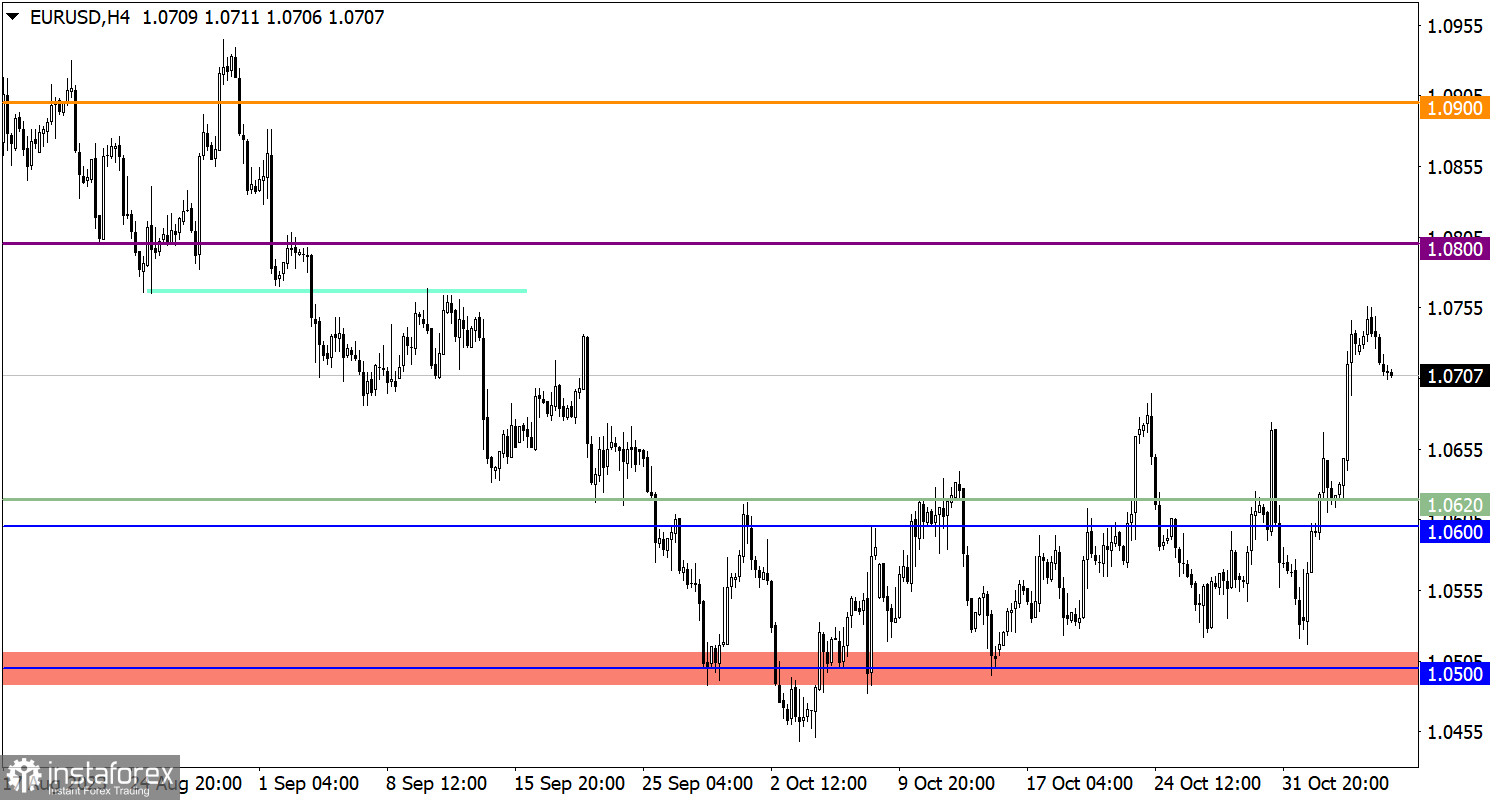
The EUR/USD currency pair reduced the volume of long positions around the 1.0750 level. As a result, the upward momentum was interrupted, and a pullback emerged in its place.
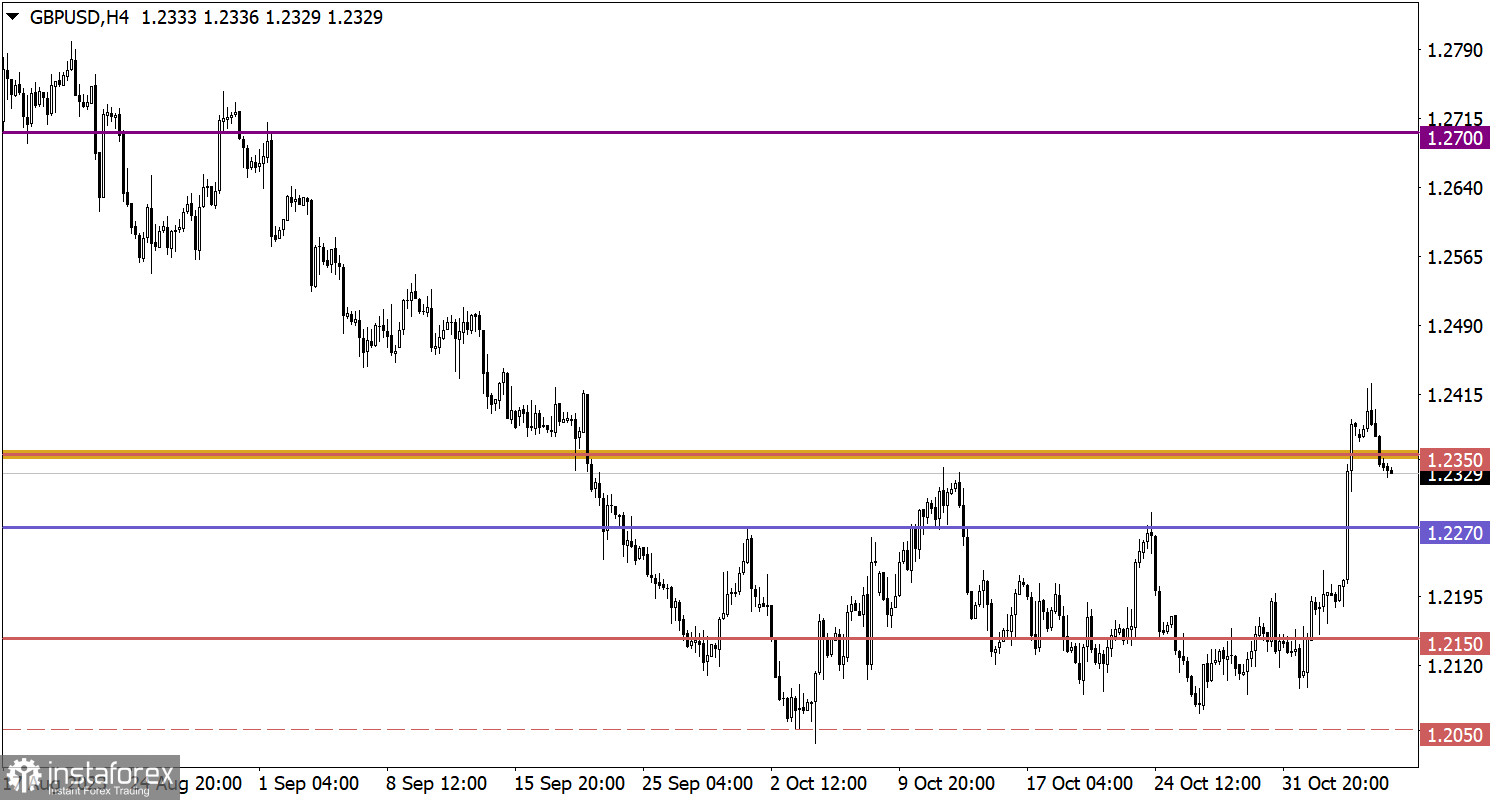
A similar technical picture can be observed for the GBP/USD currency pair. The upward cycle was interrupted around the 1.2400 level, where the volume of long positions decreased. As a result, a pullback occurred, pushing the quote below the 1.2350 mark.
Today, data on producer prices in the Eurozone is expected to be published, and the rate of decline may accelerate from -11.5% to -12.6%. In light of this data, it can be assumed that inflation will continue to decline, further increasing the likelihood of ECB interest rate cuts.
If the pullback continues to form, a further weakening of the euro towards 1.0650–1.0620 is possible. As for the bullish scenario, for its consideration, the quote needs to stabilize above the 1.0750 mark.
In the case of further pullback formation, a decline in the quote to the 1.2270 level is possible. As for the bullish scenario, it will be considered by traders if the price returns above the 1.2400 level.
The candlestick chart type is white and black graphic rectangles with lines above and below. With a detailed analysis of each individual candle, you can see its characteristics relative to a particular time frame: opening price, closing price, intraday high and low.
Horizontal levels are price coordinates, relative to which a price may stop or reverse its trajectory. In the market, these levels are called support and resistance.
Circles and rectangles are highlighted examples where the price reversed in history. This color highlighting indicates horizontal lines that may put pressure on the asset's price in the future.
The up/down arrows are landmarks of the possible price direction in the future.
*El análisis de mercado publicado aquí tiene la finalidad de incrementar su conocimiento, más no darle instrucciones para realizar una operación.
¡Los informes analíticos de InstaSpot lo mantendrá bien informado de las tendencias del mercado! Al ser un cliente de InstaSpot, se le proporciona una gran cantidad de servicios gratuitos para una operación eficiente.


