


انسٹا فاریکس ٹیم میں لیجنڈ!
لیجنڈ!آپ کو لگتا ہے کہ یہ حیرت انگیز بیانات ہے؟ لیکن ہمیں ایسے شخص کو کیا کہنا چاہئے ، جو 18 سال میں جونیئر ورلڈ شطرنج چیمپئن شپ جیتنے والا پہلا ایشین بن گیا تھا اور 19 میں پہلا ہندوستانی گرینڈ ماسٹر بنا؟ ورلڈ چیمپیئن ٹائٹل کے لئے یہ مشکل آغاز تھا جو وشونااتھ آنند کے لئے تھا ، وہ شخص جو ہمیشہ کے لئے شطرنج کی تاریخ کا حصہ بن گیا تھا۔ انسٹا فاریکس ٹیم میں اب ایک اور لیجنڈ!


Borussia is one of the most titled football clubs in Germany, which has repeatedly proved to fans: the spirit of competition and leadership will certainly lead to success. Trade in the same way that sports professionals play the game: confidently and actively. Keep a "pass" from Borussia FC and be in the lead with InstaSpot!

On Monday, the final data on the Eurozone Services Business Activity Index were published, along with the Composite Business Activity Index, which both completely matched the preliminary estimates.
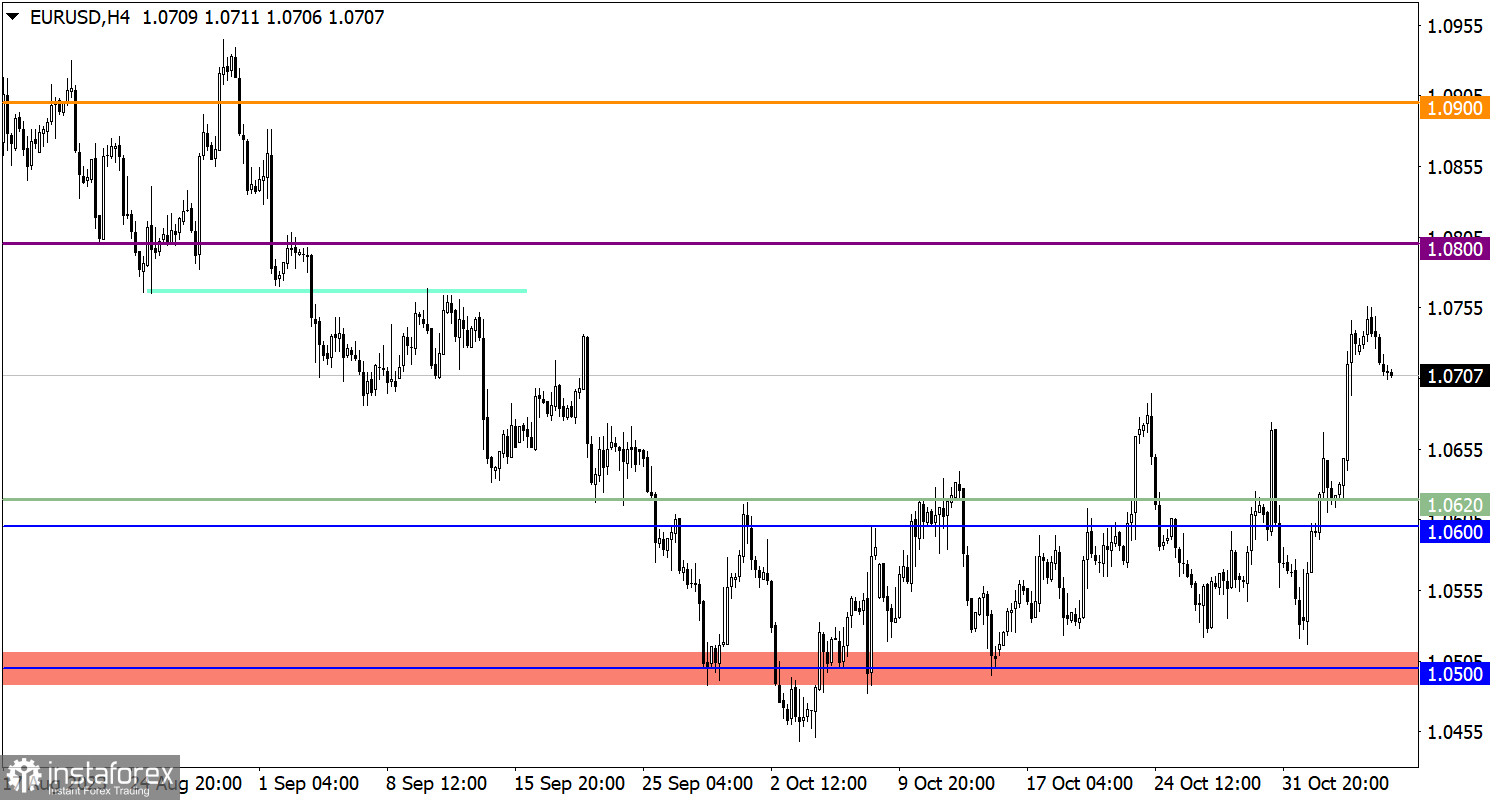
The EUR/USD currency pair reduced the volume of long positions around the 1.0750 level. As a result, the upward momentum was interrupted, and a pullback emerged in its place.
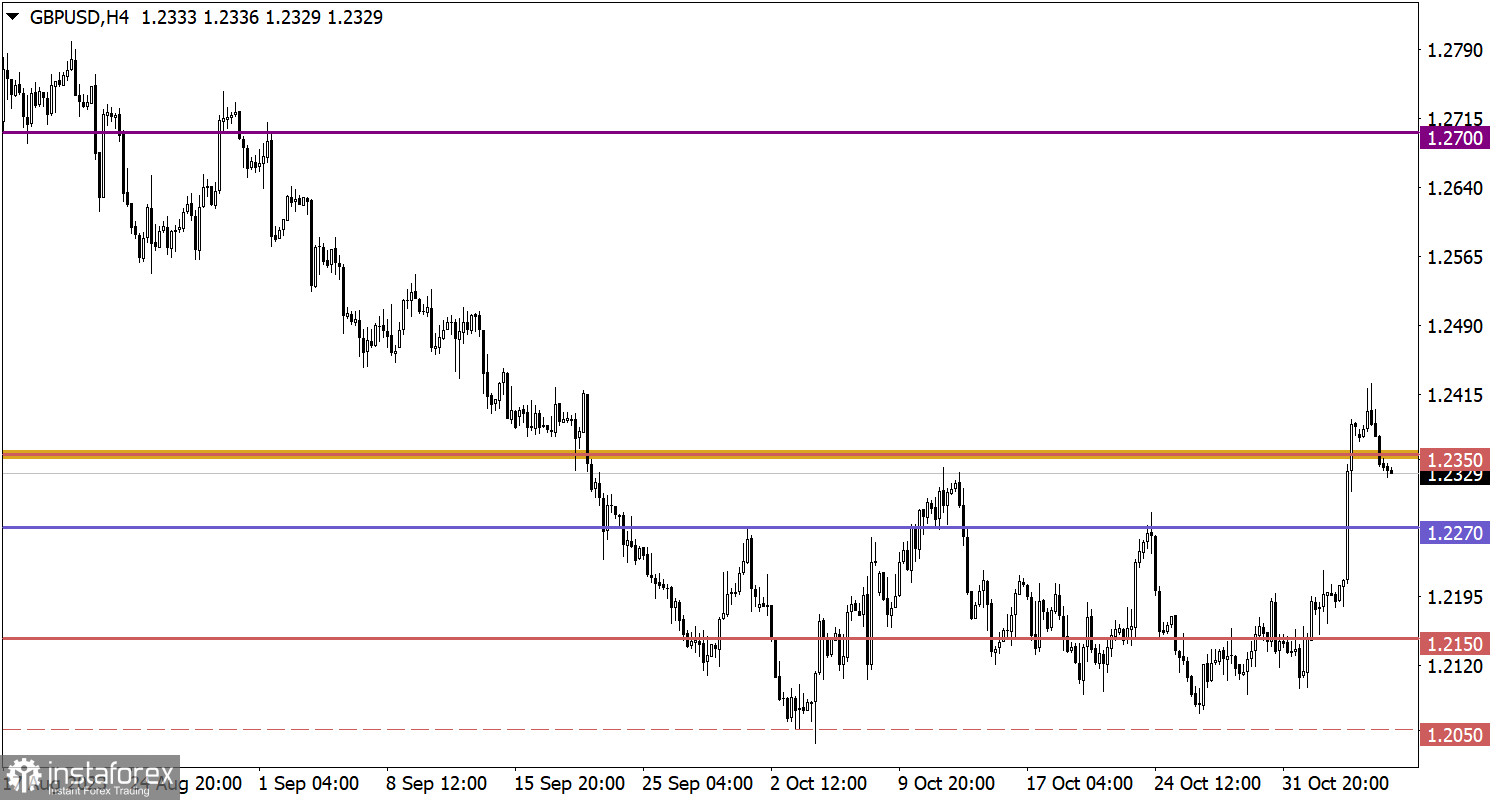
A similar technical picture can be observed for the GBP/USD currency pair. The upward cycle was interrupted around the 1.2400 level, where the volume of long positions decreased. As a result, a pullback occurred, pushing the quote below the 1.2350 mark.
Today, data on producer prices in the Eurozone is expected to be published, and the rate of decline may accelerate from -11.5% to -12.6%. In light of this data, it can be assumed that inflation will continue to decline, further increasing the likelihood of ECB interest rate cuts.
If the pullback continues to form, a further weakening of the euro towards 1.0650–1.0620 is possible. As for the bullish scenario, for its consideration, the quote needs to stabilize above the 1.0750 mark.
In the case of further pullback formation, a decline in the quote to the 1.2270 level is possible. As for the bullish scenario, it will be considered by traders if the price returns above the 1.2400 level.
The candlestick chart type is white and black graphic rectangles with lines above and below. With a detailed analysis of each individual candle, you can see its characteristics relative to a particular time frame: opening price, closing price, intraday high and low.
Horizontal levels are price coordinates, relative to which a price may stop or reverse its trajectory. In the market, these levels are called support and resistance.
Circles and rectangles are highlighted examples where the price reversed in history. This color highlighting indicates horizontal lines that may put pressure on the asset's price in the future.
The up/down arrows are landmarks of the possible price direction in the future.
*تعینات کیا مراد ہے مارکیٹ کے تجزیات یہاں ارسال کیے جاتے ہیں جس کا مقصد آپ کی بیداری بڑھانا ہے، لیکن تجارت کرنے کے لئے ہدایات دینا نہیں.
InstaSpot analytical reviews will make you fully aware of market trends! Being an InstaSpot client, you are provided with a large number of free services for efficient trading.


