


Nella nostra squadra ci sono più di 7.000.000 trader! Ogni giorno ci impegniamo a far sì che il trading migliori. Conseguiamo grandi risultati e ci muoviamo in avanti.
Il riconoscimento da parte di milioni di trader in tutto il mondo rappresenta l'alta valutazione della nostra attività! Voi avete fatto la vostra scelta e noi faremo la nostra al fine di soddisfare le vostre aspettative!
Assieme siamo una grande squadra!
InstaSpot. Siamo orgogliosi di lavorare per voi!


Attore, campione del mondo di lotta libera e semplicemente un vero maciste russo! Persona venuta dal nulla. Persona che rispecchia i nostri obiettivi. Il segreto del successo di Taktarov consiste nel mirare continuamente al suo scopo.
Dischiudi anche tu tutti gli aspetti del tuo talento! Impara, prova, sbaglia, ma non fermarti!
InstaSpot - la storia delle tue vittorie inizia qui!

On Monday, the final data on the Eurozone Services Business Activity Index were published, along with the Composite Business Activity Index, which both completely matched the preliminary estimates.
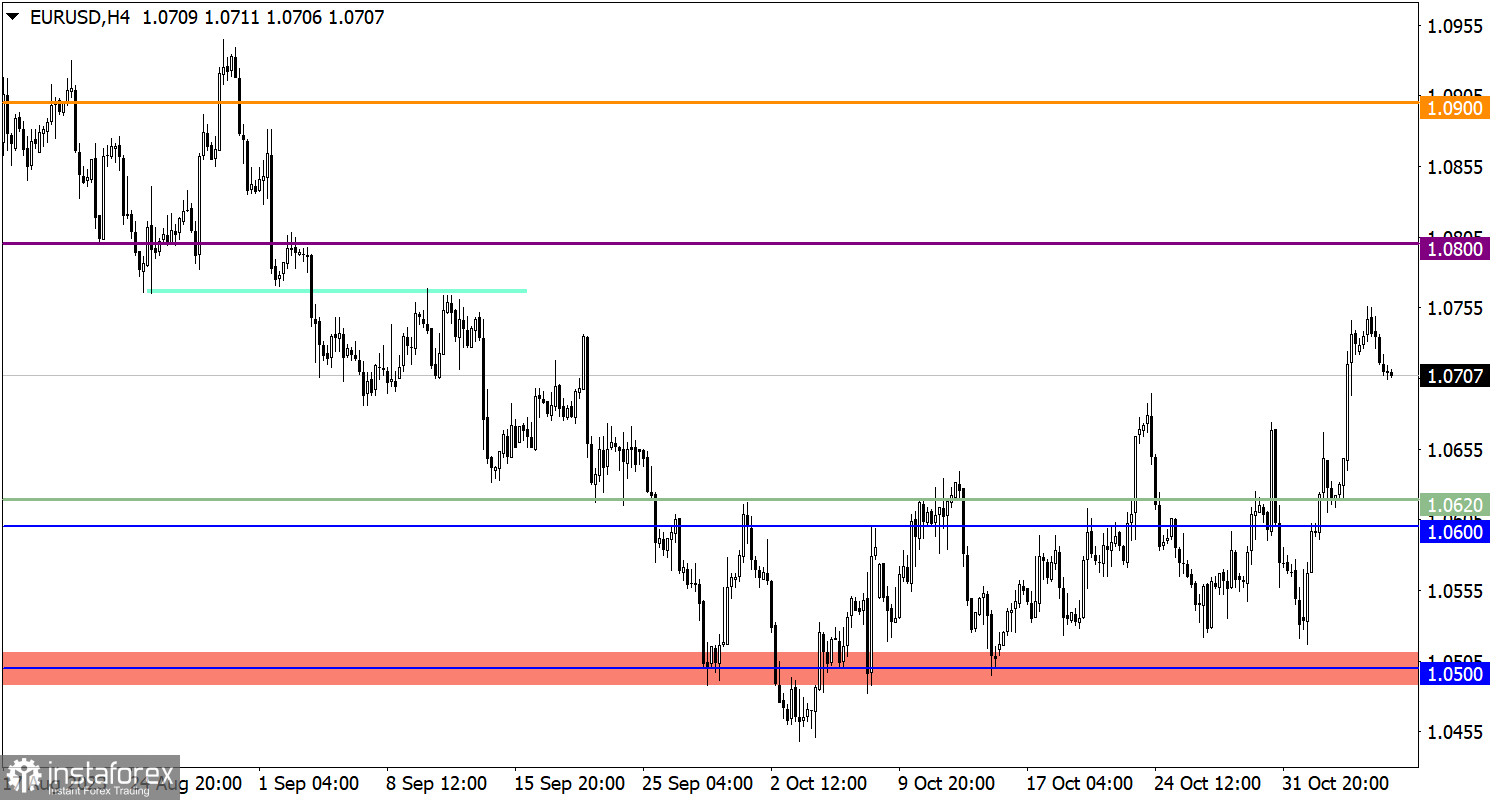
The EUR/USD currency pair reduced the volume of long positions around the 1.0750 level. As a result, the upward momentum was interrupted, and a pullback emerged in its place.
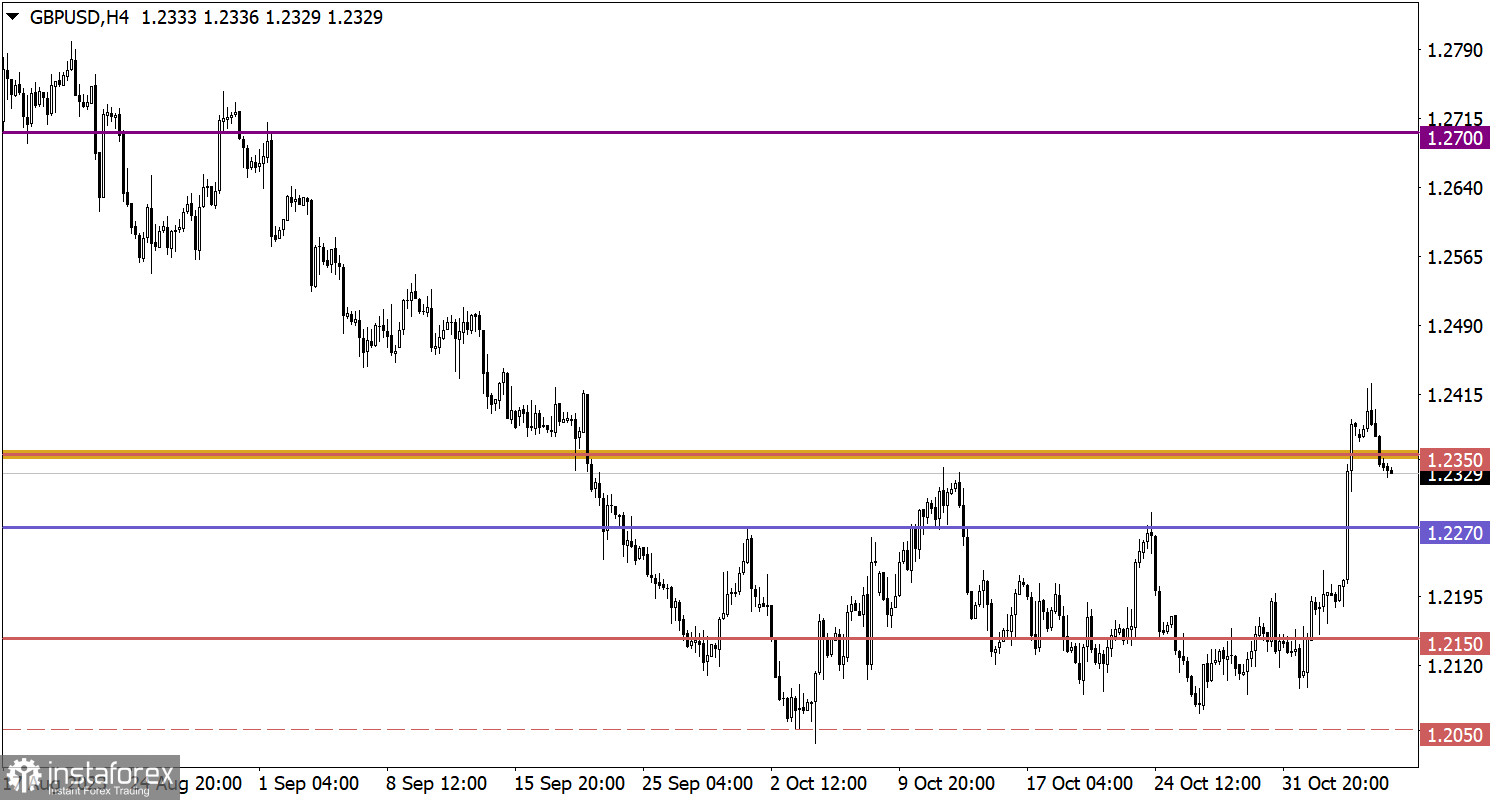
A similar technical picture can be observed for the GBP/USD currency pair. The upward cycle was interrupted around the 1.2400 level, where the volume of long positions decreased. As a result, a pullback occurred, pushing the quote below the 1.2350 mark.
Today, data on producer prices in the Eurozone is expected to be published, and the rate of decline may accelerate from -11.5% to -12.6%. In light of this data, it can be assumed that inflation will continue to decline, further increasing the likelihood of ECB interest rate cuts.
If the pullback continues to form, a further weakening of the euro towards 1.0650–1.0620 is possible. As for the bullish scenario, for its consideration, the quote needs to stabilize above the 1.0750 mark.
In the case of further pullback formation, a decline in the quote to the 1.2270 level is possible. As for the bullish scenario, it will be considered by traders if the price returns above the 1.2400 level.
The candlestick chart type is white and black graphic rectangles with lines above and below. With a detailed analysis of each individual candle, you can see its characteristics relative to a particular time frame: opening price, closing price, intraday high and low.
Horizontal levels are price coordinates, relative to which a price may stop or reverse its trajectory. In the market, these levels are called support and resistance.
Circles and rectangles are highlighted examples where the price reversed in history. This color highlighting indicates horizontal lines that may put pressure on the asset's price in the future.
The up/down arrows are landmarks of the possible price direction in the future.
*La presente analisi del mercato ha un carattere esclusivamente informativo e non rappresenta una guida per l`effettuazione di una transazione.
Le recensioni analitiche di InstaSpot ti renderanno pienamente consapevole delle tendenze del mercato! Essendo un cliente InstaSpot, ti viene fornito un gran numero di servizi gratuiti per il trading efficiente.


