


¡La leyenda en el equipo de InstaSpot!
¡Leyenda! ¿Cree que es una retórica grandilocuente? Pero, ¿cómo deberíamos llamar a un hombre, que se convirtió en el primer asiático en ganar el campeonato mundial de ajedrez júnior a los 18 años y en el primer Gran Maestro indio a los 19 años? Ese fue el comienzo de un camino difícil hacia el título de Campeón del Mundo para Viswanathan Anand, el hombre que se convirtió en parte de la historia del ajedrez para siempre. ¡Ahora una leyenda más en el equipo de InstaSpot!


Borussia es uno de los clubes de fútbol con más títulos en Alemania, que ha demostrado repetidamente a los fanáticos: el espíritu de competencia y liderazgo que ciertamente conducirán al éxito. Opere de la misma manera que los profesionales del deporte: con confianza y de forma activa. ¡Mantenga un "pase" del Borussia FC y lidere con InstaSpot!
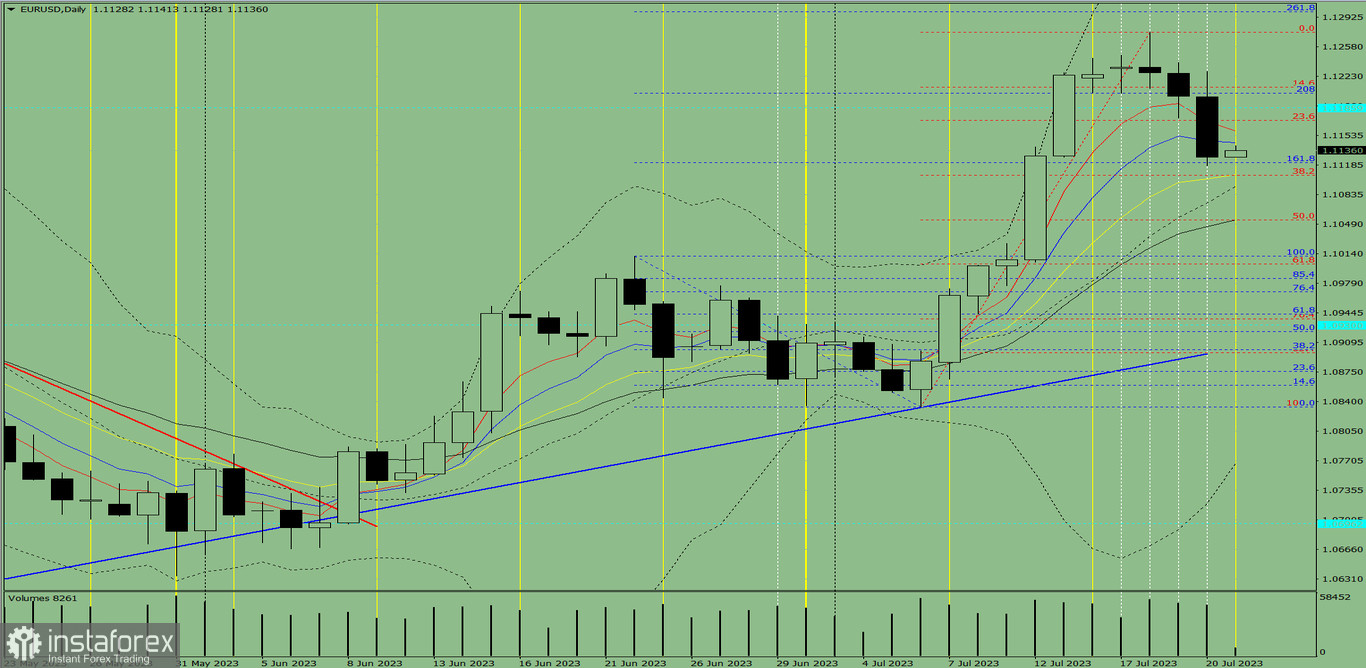
Trend analysis (fig.1)
On Friday, the pair may increase from 1.1128 (the closing of yesterday's daily candlestick) to 1.1171 (red dotted line), the Fibonacci retracement level of 23.6%. When testing this level, it could rise higher.
Complex analysis:
- indicator analysis – up;
- Fibonacci retracement levels – up;
- candlestick analysis – up;
- trend analysis – up;
- Bollinger lines – up;
- weekly chart-up.
Conclusion:
On Friday, the pair may rise from 1.1128 (the closing of yesterday's daily candlestick) to 1.1171 (red dotted line), the Fibonacci retracement level of 23.6%. When testing this level, it could climb higher.
Alternatively, the pair may start moving up to the target level of 1.1203 (blue dotted line), the Fibonacci retracement level of 208%,
from 1.1128 (the closing of yesterday's daily candlestick). When testing this level, it could roll back.
*El análisis de mercado publicado aquí tiene la finalidad de incrementar su conocimiento, más no darle instrucciones para realizar una operación.
¡Los informes analíticos de InstaSpot lo mantendrá bien informado de las tendencias del mercado! Al ser un cliente de InstaSpot, se le proporciona una gran cantidad de servicios gratuitos para una operación eficiente.


