


Nossa equipe tem mais de 7,000,000 traders!
Todos os dias, trabalhamos juntos para melhorar a negociação. Obtivemos resultados elevados e avançamos.
O reconhecimento de milhões de traders em todo o mundo é a melhor apreciação do nosso trabalho! Você nos escolheu e faremos tudo o que for necessário para atender às suas expectativas!
Nós somos uma ótima equipe juntos!
InstaSpot. Orgulho de trabalhar para você!


Ator, hexacampeão do UFC e um verdadeiro herói!
Um homem de sucesso. Um homem que mostra o nosso caminho.
O segredo por trás do sucesso de Taktarov é um movimento constante em direção ao objetivo.
Revele todos os lados do seu talento!
Descubra, tente, falhe, mas nunca pare!
I InstaSpot. Sua história de sucesso começa aqui!
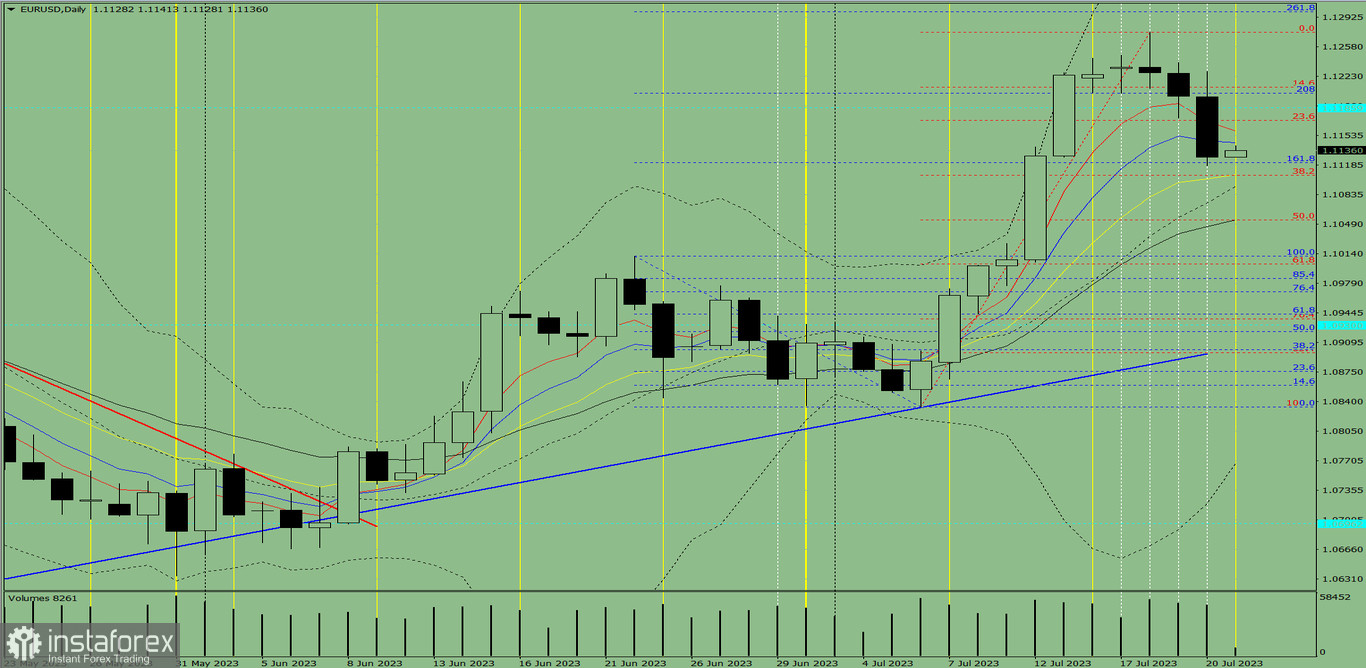
Trend analysis (fig.1)
On Friday, the pair may increase from 1.1128 (the closing of yesterday's daily candlestick) to 1.1171 (red dotted line), the Fibonacci retracement level of 23.6%. When testing this level, it could rise higher.
Complex analysis:
- indicator analysis – up;
- Fibonacci retracement levels – up;
- candlestick analysis – up;
- trend analysis – up;
- Bollinger lines – up;
- weekly chart-up.
Conclusion:
On Friday, the pair may rise from 1.1128 (the closing of yesterday's daily candlestick) to 1.1171 (red dotted line), the Fibonacci retracement level of 23.6%. When testing this level, it could climb higher.
Alternatively, the pair may start moving up to the target level of 1.1203 (blue dotted line), the Fibonacci retracement level of 208%,
from 1.1128 (the closing of yesterday's daily candlestick). When testing this level, it could roll back.
*A análise de mercado aqui postada destina-se a aumentar o seu conhecimento, mas não dar instruções para fazer uma negociação.
InstaSpot analytical reviews will make you fully aware of market trends! Being an InstaSpot client, you are provided with a large number of free services for efficient trading.


