


The legend in the InstaSpot team!
Legend! You think that's bombastic rhetoric? But how should we call a man, who became the first Asian to win the junior world chess championship at 18 and who became the first Indian Grandmaster at 19? That was the start of a hard path to the World Champion title for Viswanathan Anand, the man who became a part of history of chess forever. Now one more legend in the InstaSpot team!


Borussia is one of the most titled football clubs in Germany, which has repeatedly proved to fans: the spirit of competition and leadership will certainly lead to success. Trade in the same way that sports professionals play the game: confidently and actively. Keep a "pass" from Borussia FC and be in the lead with InstaSpot!

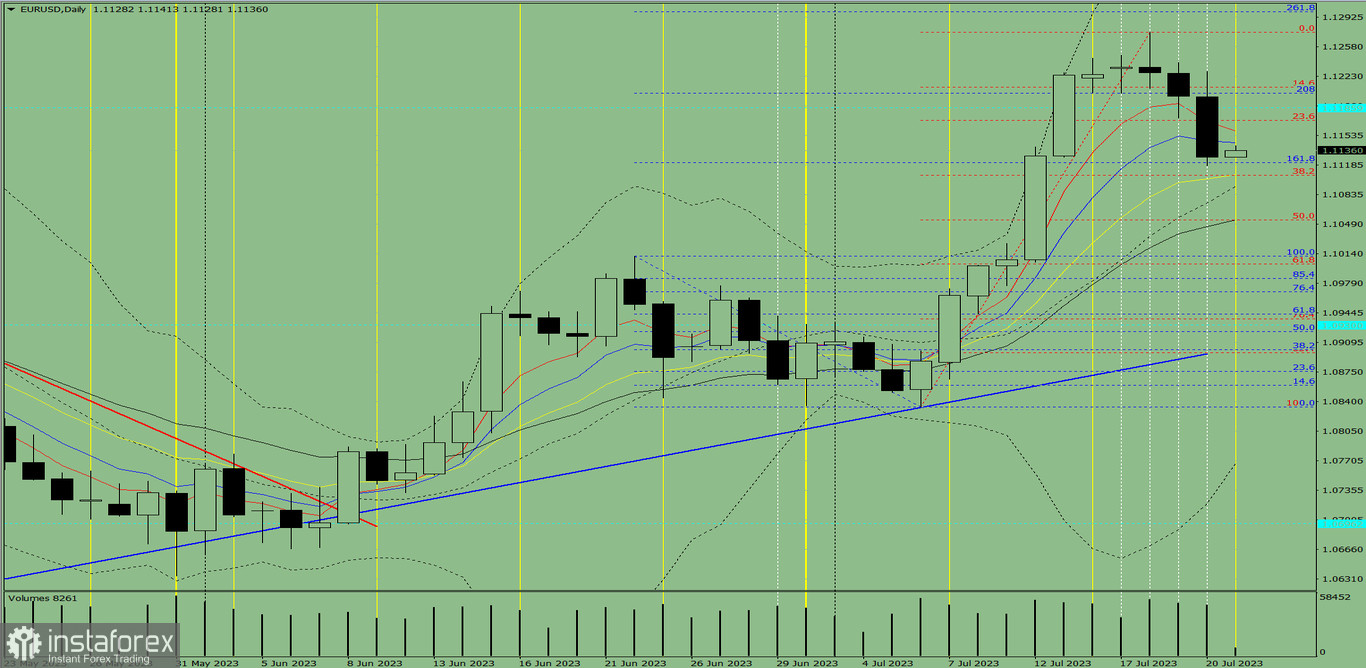
Trend analysis (fig.1)
On Friday, the pair may increase from 1.1128 (the closing of yesterday's daily candlestick) to 1.1171 (red dotted line), the Fibonacci retracement level of 23.6%. When testing this level, it could rise higher.
Complex analysis:
- indicator analysis – up;
- Fibonacci retracement levels – up;
- candlestick analysis – up;
- trend analysis – up;
- Bollinger lines – up;
- weekly chart-up.
Conclusion:
On Friday, the pair may rise from 1.1128 (the closing of yesterday's daily candlestick) to 1.1171 (red dotted line), the Fibonacci retracement level of 23.6%. When testing this level, it could climb higher.
Alternatively, the pair may start moving up to the target level of 1.1203 (blue dotted line), the Fibonacci retracement level of 208%,
from 1.1128 (the closing of yesterday's daily candlestick). When testing this level, it could roll back.
*এখানে পোস্ট করা মার্কেট বিশ্লেষণ আপনার সচেতনতা বৃদ্ধির জন্য প্রদান করা হয়, ট্রেড করার নির্দেশনা প্রদানের জন্য প্রদান করা হয় না।
ইন্সটাফরেক্স বিশ্লেষণমূলক পর্যালোচনাগুলো আপনাকে মার্কেট প্রবণতা সম্পর্কে পুরোপুরি সচেতন করবে! ইন্সটাফরেক্সের একজন গ্রাহক হওয়ায়, দক্ষ ট্রেডিং এর জন্য আপনাকে অনেক সেবা বিনামূল্যে প্রদান করা হয়।


