


¡Nuestro equipo cuenta con más de 7,000,000 operadores!
Cada día, trabajamos juntos para mejorar las operaciones. Obtenemos grandes resultados y seguimos adelante.
El reconocimiento de millones de operadores en todo el mundo es el mejor agradecimiento a nuestro trabajo! ¡Usted hizo su elección y haremos todo lo que esté a nuestro alcance para satisfacer sus expectativas!
¡Juntos somos un gran equipo!
InstaSpot. ¡Orgulloso de trabajar para usted!


¡Actor, 6 veces ganador del torneo UFC y un verdadero héroe!
El hombre que se hizo a sí mismo. El hombre que sigue nuestro camino.
El secreto detrás del éxito de Taktarov es el constante movimiento hacia el objetivo.
¡Revele todo los lados de su talento!
Descubra, intente, fracase, ¡pero nunca se rinda!
InstaSpot. ¡Su historia de éxito comienza aquí!
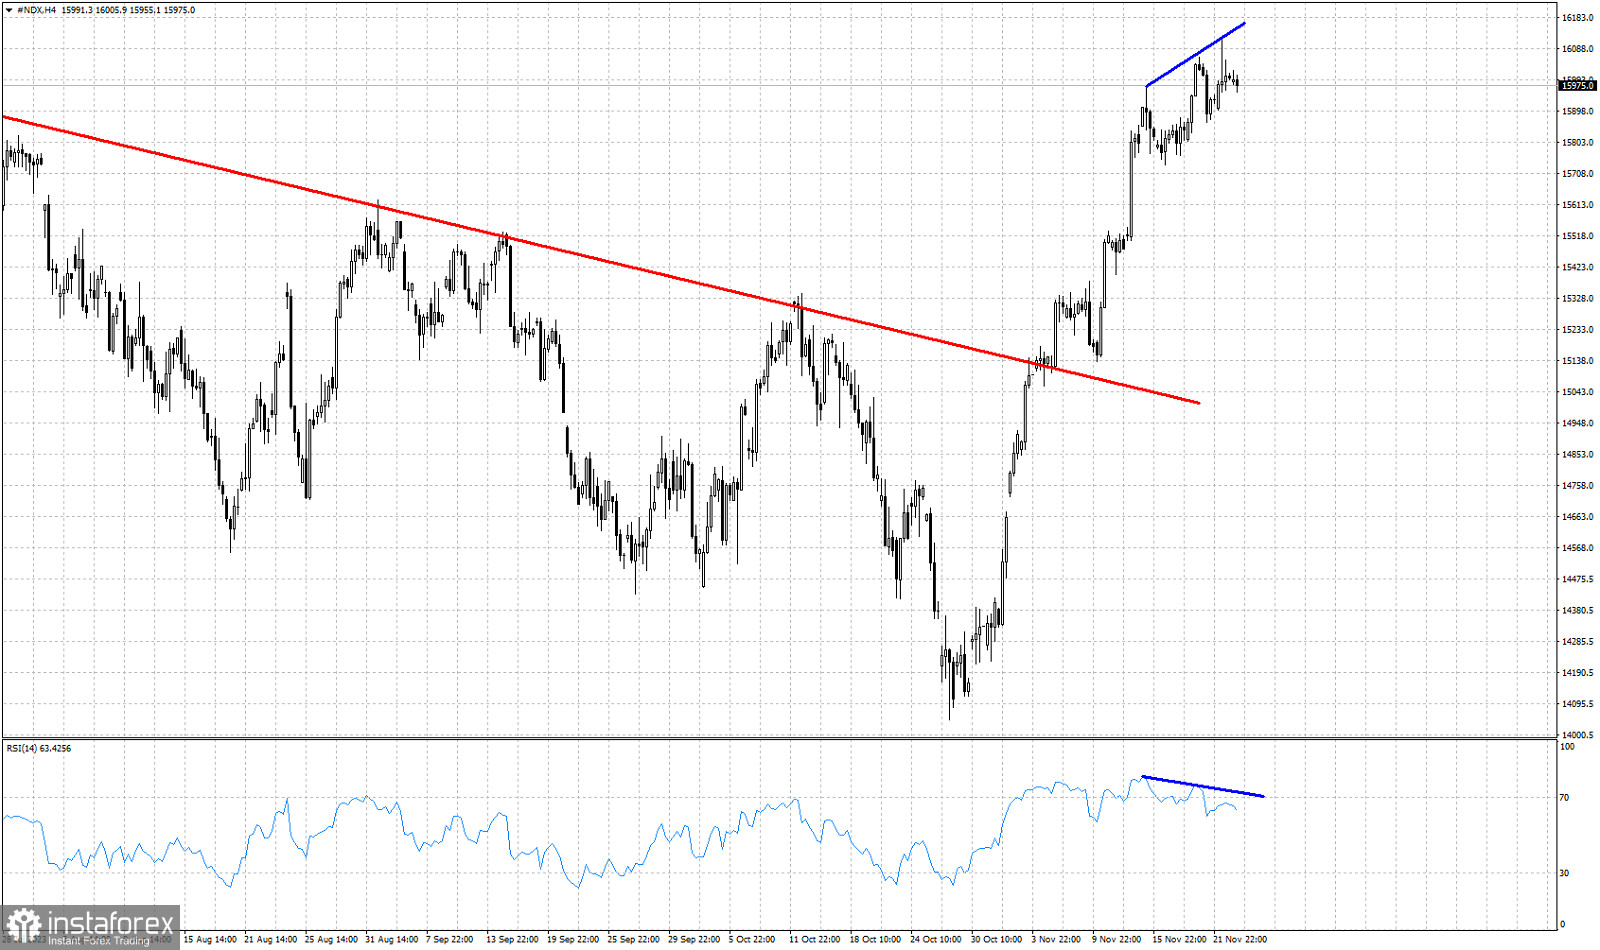
Red line -resistance trend line (broken)
Blue lines- RSI bearish divergence signs.
Nasdaq is trading around 15,970. There are increased chances that the top is in and we are at the early stages of a reversal. Technically trend remains bullish as price continues making higher highs and higher lows. The RSI is making lower highs providing us with bearish divergence signs. The index has made an impressive almost vertical rise during the last 30 days breaking above key resistance trend line. At current levels we believe that it is more probable for price to make at least a pull back to back test the broken trend line. The RSI has provided us with a first warning. A break below 15,860 will be our first sell signal if and when it comes.
*El análisis de mercado publicado aquí tiene la finalidad de incrementar su conocimiento, más no darle instrucciones para realizar una operación.
¡Los informes analíticos de InstaSpot lo mantendrá bien informado de las tendencias del mercado! Al ser un cliente de InstaSpot, se le proporciona una gran cantidad de servicios gratuitos para una operación eficiente.


