


Our team has over 7,000,000 traders!
Every day we work together to improve trading. We get high results and move forward.
Recognition by millions of traders all over the world is the best appreciation of our work! You made your choice and we will do everything it takes to meet your expectations!
We are a great team together!
InstaSpot. Proud to work for you!


Actor, UFC 6 tournament champion and a true hero!
The man who made himself. The man that goes our way.
The secret behind Taktarov's success is constant movement towards the goal.
Reveal all the sides of your talent!
Discover, try, fail - but never stop!
InstaSpot. Your success story starts here!

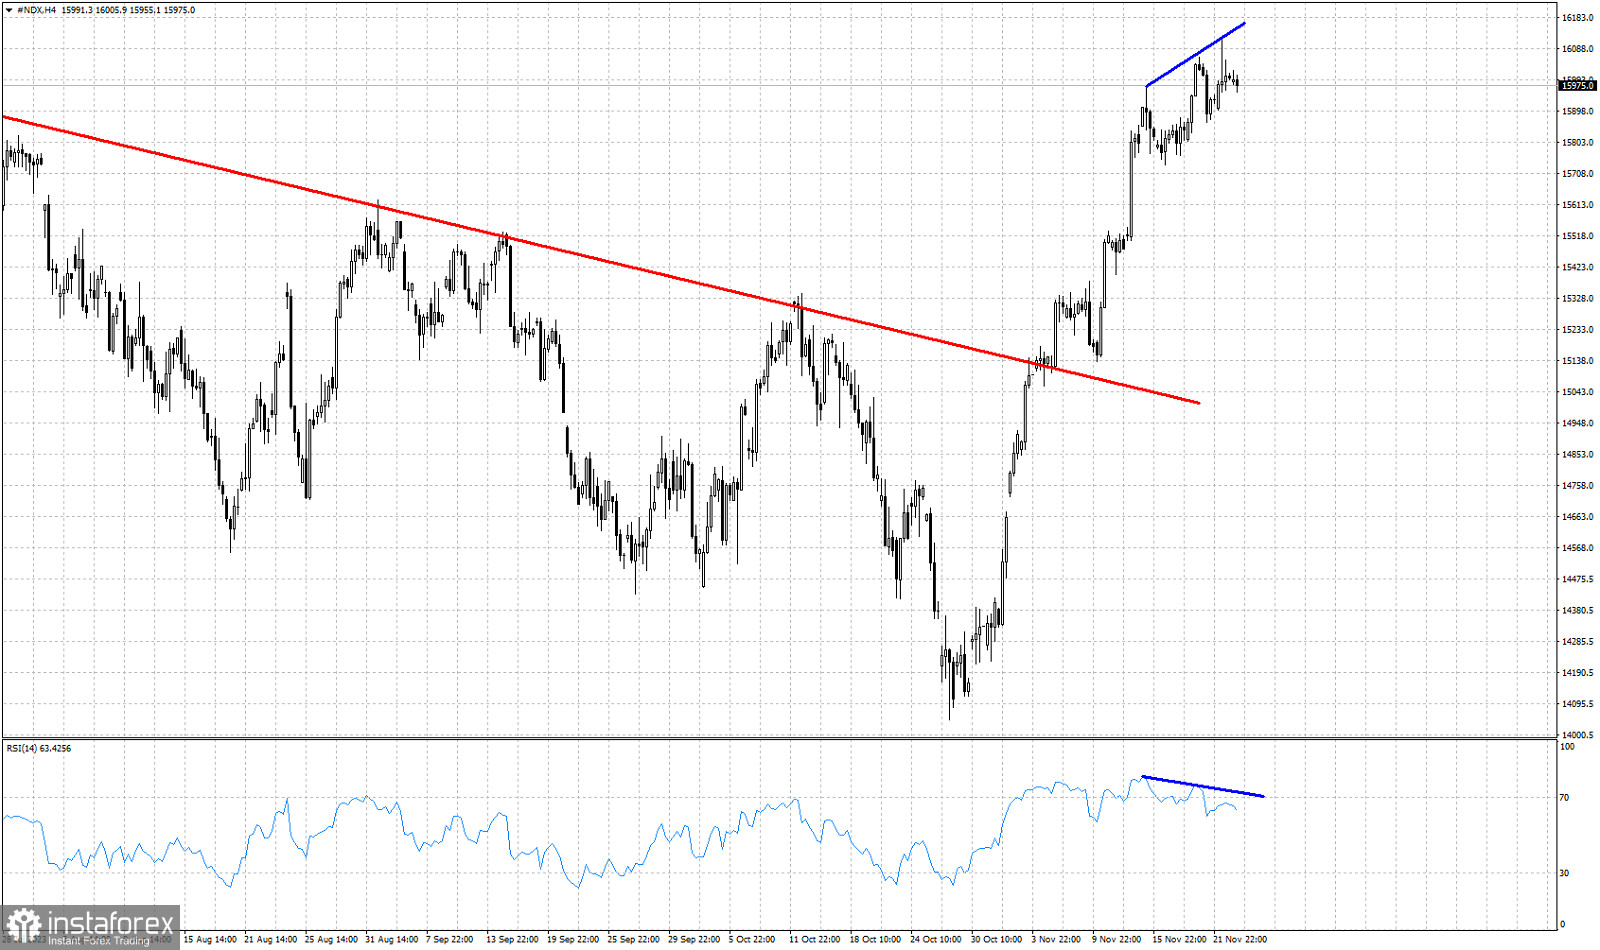
Red line -resistance trend line (broken)
Blue lines- RSI bearish divergence signs.
Nasdaq is trading around 15,970. There are increased chances that the top is in and we are at the early stages of a reversal. Technically trend remains bullish as price continues making higher highs and higher lows. The RSI is making lower highs providing us with bearish divergence signs. The index has made an impressive almost vertical rise during the last 30 days breaking above key resistance trend line. At current levels we believe that it is more probable for price to make at least a pull back to back test the broken trend line. The RSI has provided us with a first warning. A break below 15,860 will be our first sell signal if and when it comes.
*এখানে পোস্ট করা মার্কেট বিশ্লেষণ আপনার সচেতনতা বৃদ্ধির জন্য প্রদান করা হয়, ট্রেড করার নির্দেশনা প্রদানের জন্য প্রদান করা হয় না।
ইন্সটাফরেক্স বিশ্লেষণমূলক পর্যালোচনাগুলো আপনাকে মার্কেট প্রবণতা সম্পর্কে পুরোপুরি সচেতন করবে! ইন্সটাফরেক্সের একজন গ্রাহক হওয়ায়, দক্ষ ট্রেডিং এর জন্য আপনাকে অনেক সেবা বিনামূল্যে প্রদান করা হয়।


