


The legend in the InstaSpot team!
Legend! You think that's bombastic rhetoric? But how should we call a man, who became the first Asian to win the junior world chess championship at 18 and who became the first Indian Grandmaster at 19? That was the start of a hard path to the World Champion title for Viswanathan Anand, the man who became a part of history of chess forever. Now one more legend in the InstaSpot team!


Borussia is one of the most titled football clubs in Germany, which has repeatedly proved to fans: the spirit of competition and leadership will certainly lead to success. Trade in the same way that sports professionals play the game: confidently and actively. Keep a "pass" from Borussia FC and be in the lead with InstaSpot!

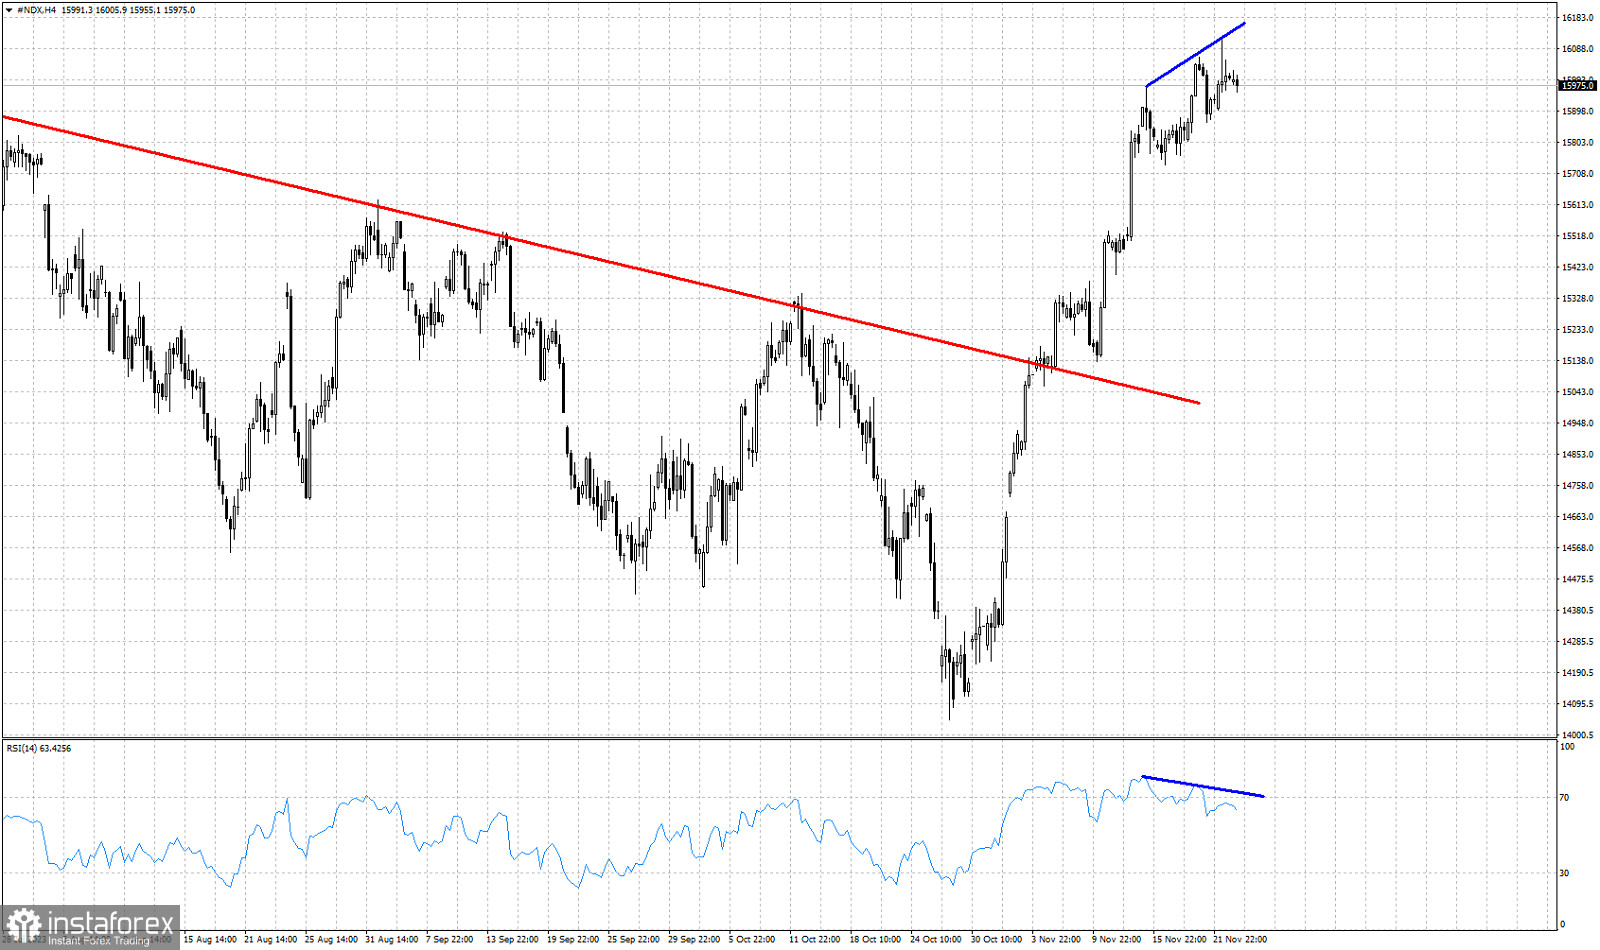
Red line -resistance trend line (broken)
Blue lines- RSI bearish divergence signs.
Nasdaq is trading around 15,970. There are increased chances that the top is in and we are at the early stages of a reversal. Technically trend remains bullish as price continues making higher highs and higher lows. The RSI is making lower highs providing us with bearish divergence signs. The index has made an impressive almost vertical rise during the last 30 days breaking above key resistance trend line. At current levels we believe that it is more probable for price to make at least a pull back to back test the broken trend line. The RSI has provided us with a first warning. A break below 15,860 will be our first sell signal if and when it comes.
*The market analysis posted here is meant to increase your awareness, but not to give instructions to make a trade.
InstaSpot analytical reviews will make you fully aware of market trends! Being an InstaSpot client, you are provided with a large number of free services for efficient trading.


