


¡La leyenda en el equipo de InstaSpot!
¡Leyenda! ¿Cree que es una retórica grandilocuente? Pero, ¿cómo deberíamos llamar a un hombre, que se convirtió en el primer asiático en ganar el campeonato mundial de ajedrez júnior a los 18 años y en el primer Gran Maestro indio a los 19 años? Ese fue el comienzo de un camino difícil hacia el título de Campeón del Mundo para Viswanathan Anand, el hombre que se convirtió en parte de la historia del ajedrez para siempre. ¡Ahora una leyenda más en el equipo de InstaSpot!


Borussia es uno de los clubes de fútbol con más títulos en Alemania, que ha demostrado repetidamente a los fanáticos: el espíritu de competencia y liderazgo que ciertamente conducirán al éxito. Opere de la misma manera que los profesionales del deporte: con confianza y de forma activa. ¡Mantenga un "pase" del Borussia FC y lidere con InstaSpot!
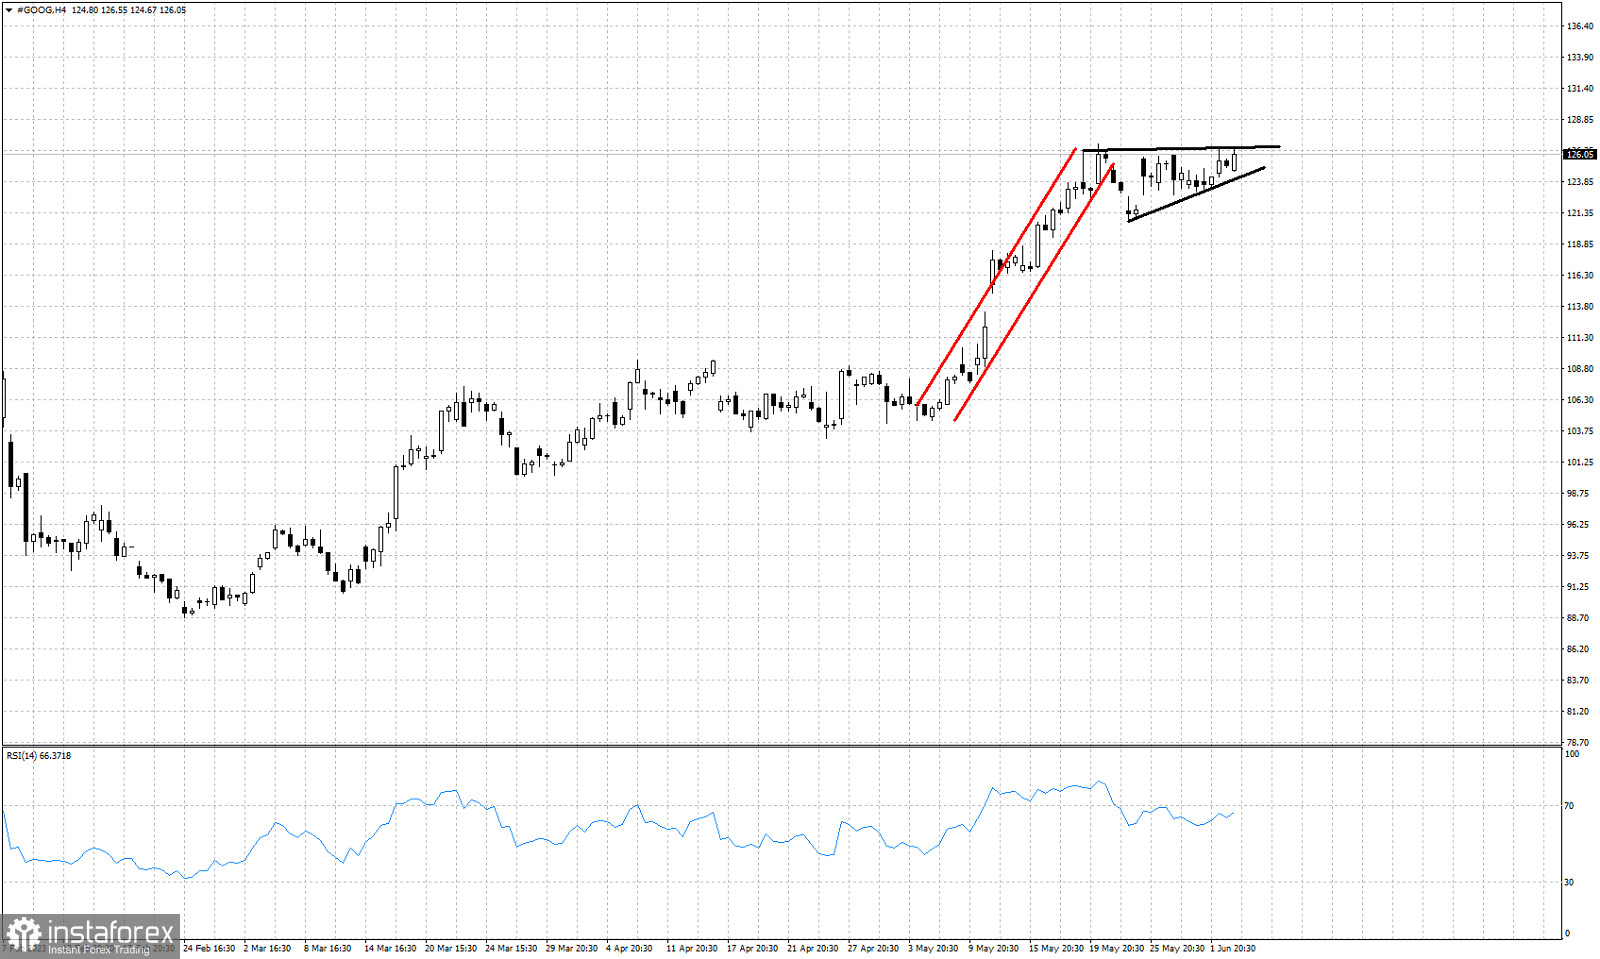
Red lines - bullish channel
Black lines- ascending triangle pattern
GOOG stock price remains in a bullish trend making higher highs and higher lows. In previous posts we talked extensively about the upside potential targets following our April and May analysis. Short-term price action suggests that another bullish formation is in the making and GOOG stock price could continue its upward move towards $132 at least. GOOG stock price has formed an ascending triangle pattern after the bullish channel price was in. This is a continuation pattern and when price breaks above $127 on a daily closing basis, we will get a new bullish signal targeting at least $132. Traders should not forget to check the RSI for any possible bearish divergence warning. Support is at $123. Bulls do not want to see price break below this level.
*El análisis de mercado publicado aquí tiene la finalidad de incrementar su conocimiento, más no darle instrucciones para realizar una operación.
¡Los informes analíticos de InstaSpot lo mantendrá bien informado de las tendencias del mercado! Al ser un cliente de InstaSpot, se le proporciona una gran cantidad de servicios gratuitos para una operación eficiente.


