


Nella nostra squadra ci sono più di 7.000.000 trader! Ogni giorno ci impegniamo a far sì che il trading migliori. Conseguiamo grandi risultati e ci muoviamo in avanti.
Il riconoscimento da parte di milioni di trader in tutto il mondo rappresenta l'alta valutazione della nostra attività! Voi avete fatto la vostra scelta e noi faremo la nostra al fine di soddisfare le vostre aspettative!
Assieme siamo una grande squadra!
InstaSpot. Siamo orgogliosi di lavorare per voi!


Attore, campione del mondo di lotta libera e semplicemente un vero maciste russo! Persona venuta dal nulla. Persona che rispecchia i nostri obiettivi. Il segreto del successo di Taktarov consiste nel mirare continuamente al suo scopo.
Dischiudi anche tu tutti gli aspetti del tuo talento! Impara, prova, sbaglia, ma non fermarti!
InstaSpot - la storia delle tue vittorie inizia qui!

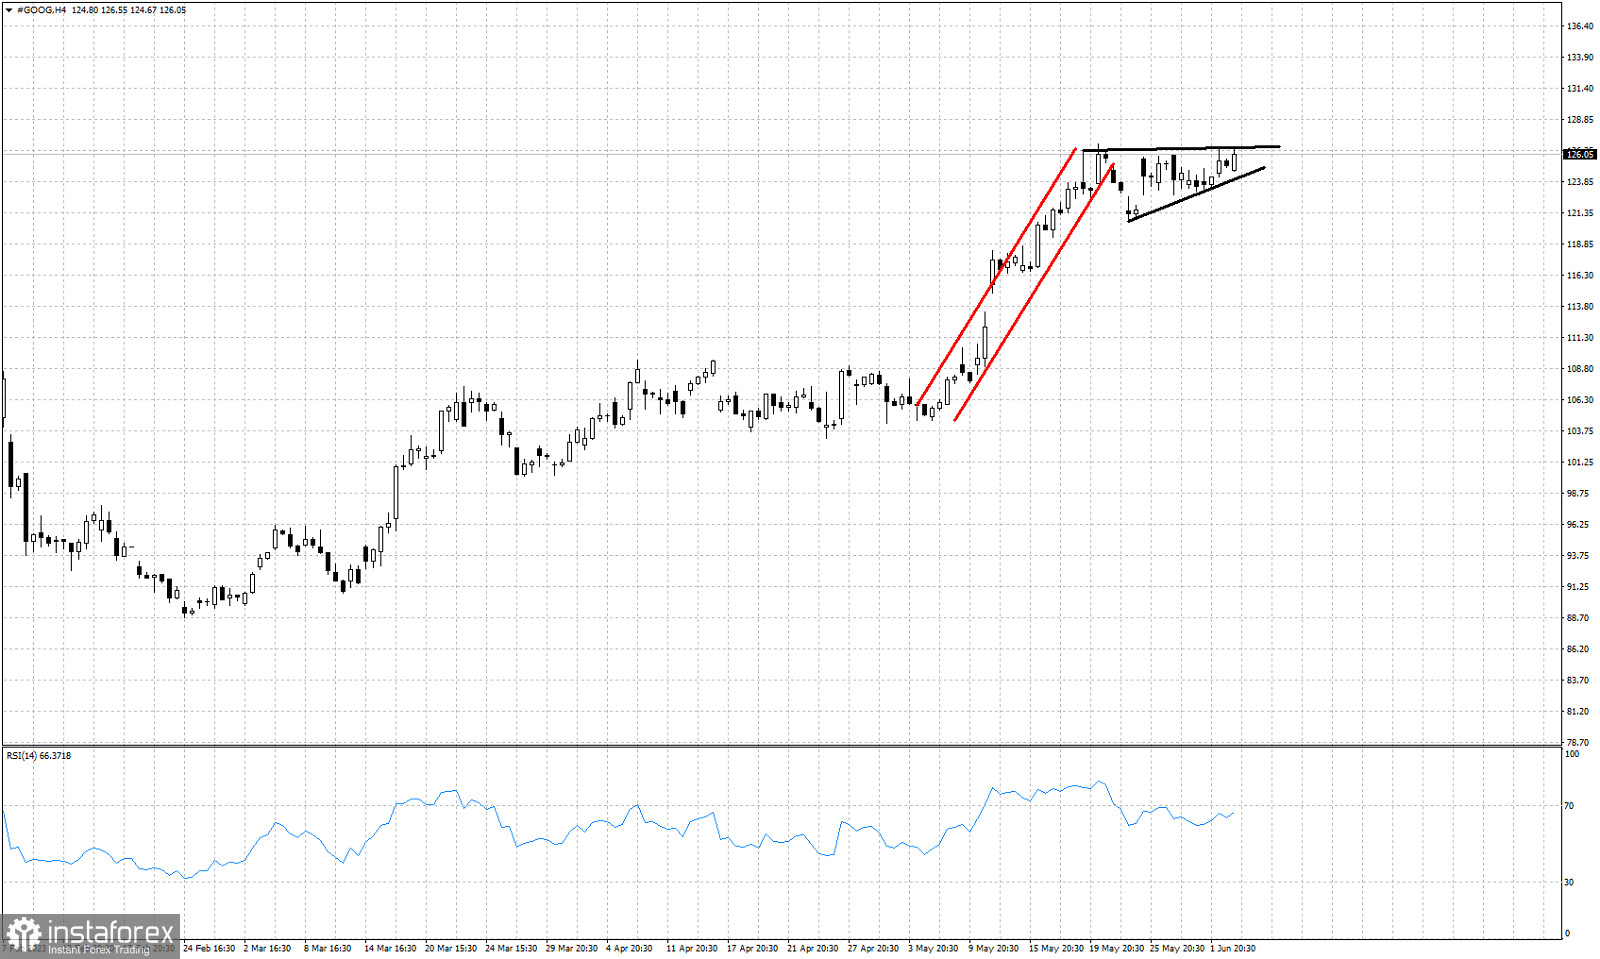
Red lines - bullish channel
Black lines- ascending triangle pattern
GOOG stock price remains in a bullish trend making higher highs and higher lows. In previous posts we talked extensively about the upside potential targets following our April and May analysis. Short-term price action suggests that another bullish formation is in the making and GOOG stock price could continue its upward move towards $132 at least. GOOG stock price has formed an ascending triangle pattern after the bullish channel price was in. This is a continuation pattern and when price breaks above $127 on a daily closing basis, we will get a new bullish signal targeting at least $132. Traders should not forget to check the RSI for any possible bearish divergence warning. Support is at $123. Bulls do not want to see price break below this level.
*La presente analisi del mercato ha un carattere esclusivamente informativo e non rappresenta una guida per l`effettuazione di una transazione.
Le recensioni analitiche di InstaSpot ti renderanno pienamente consapevole delle tendenze del mercato! Essendo un cliente InstaSpot, ti viene fornito un gran numero di servizi gratuiti per il trading efficiente.


