


Our team has over 7,000,000 traders!
Every day we work together to improve trading. We get high results and move forward.
Recognition by millions of traders all over the world is the best appreciation of our work! You made your choice and we will do everything it takes to meet your expectations!
We are a great team together!
InstaSpot. Proud to work for you!


Actor, UFC 6 tournament champion and a true hero!
The man who made himself. The man that goes our way.
The secret behind Taktarov's success is constant movement towards the goal.
Reveal all the sides of your talent!
Discover, try, fail - but never stop!
InstaSpot. Your success story starts here!

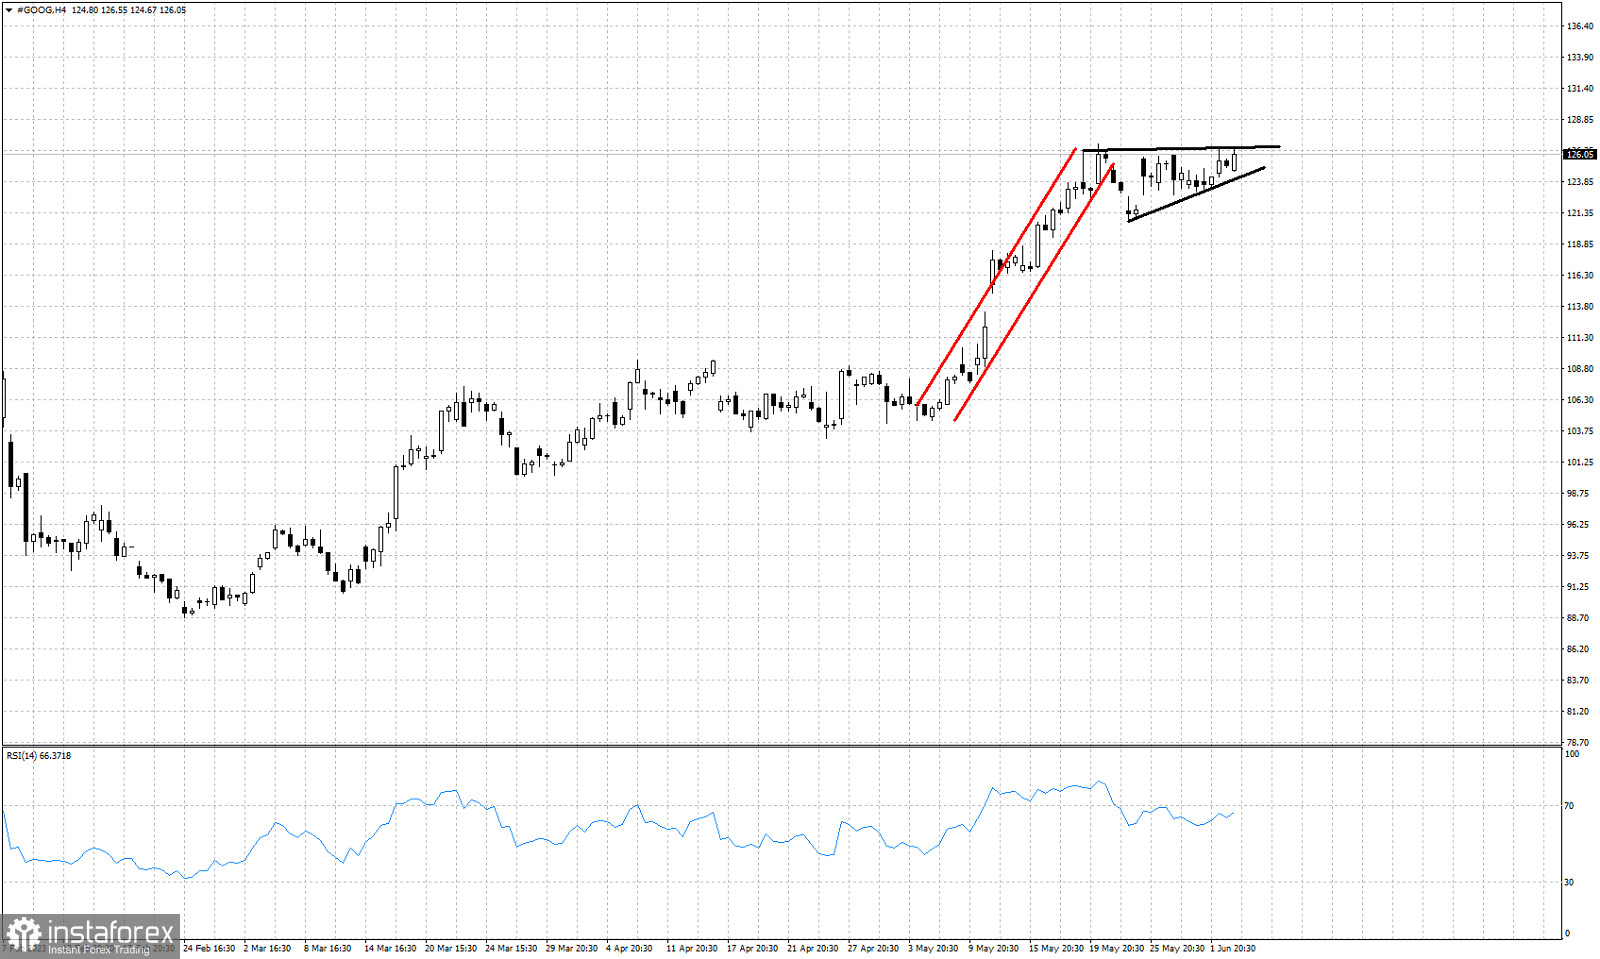
Red lines - bullish channel
Black lines- ascending triangle pattern
GOOG stock price remains in a bullish trend making higher highs and higher lows. In previous posts we talked extensively about the upside potential targets following our April and May analysis. Short-term price action suggests that another bullish formation is in the making and GOOG stock price could continue its upward move towards $132 at least. GOOG stock price has formed an ascending triangle pattern after the bullish channel price was in. This is a continuation pattern and when price breaks above $127 on a daily closing basis, we will get a new bullish signal targeting at least $132. Traders should not forget to check the RSI for any possible bearish divergence warning. Support is at $123. Bulls do not want to see price break below this level.
*The market analysis posted here is meant to increase your awareness, but not to give instructions to make a trade.
InstaSpot analytical reviews will make you fully aware of market trends! Being an InstaSpot client, you are provided with a large number of free services for efficient trading.


