


¡La leyenda en el equipo de InstaSpot!
¡Leyenda! ¿Cree que es una retórica grandilocuente? Pero, ¿cómo deberíamos llamar a un hombre, que se convirtió en el primer asiático en ganar el campeonato mundial de ajedrez júnior a los 18 años y en el primer Gran Maestro indio a los 19 años? Ese fue el comienzo de un camino difícil hacia el título de Campeón del Mundo para Viswanathan Anand, el hombre que se convirtió en parte de la historia del ajedrez para siempre. ¡Ahora una leyenda más en el equipo de InstaSpot!


Borussia es uno de los clubes de fútbol con más títulos en Alemania, que ha demostrado repetidamente a los fanáticos: el espíritu de competencia y liderazgo que ciertamente conducirán al éxito. Opere de la misma manera que los profesionales del deporte: con confianza y de forma activa. ¡Mantenga un "pase" del Borussia FC y lidere con InstaSpot!
[Gold]
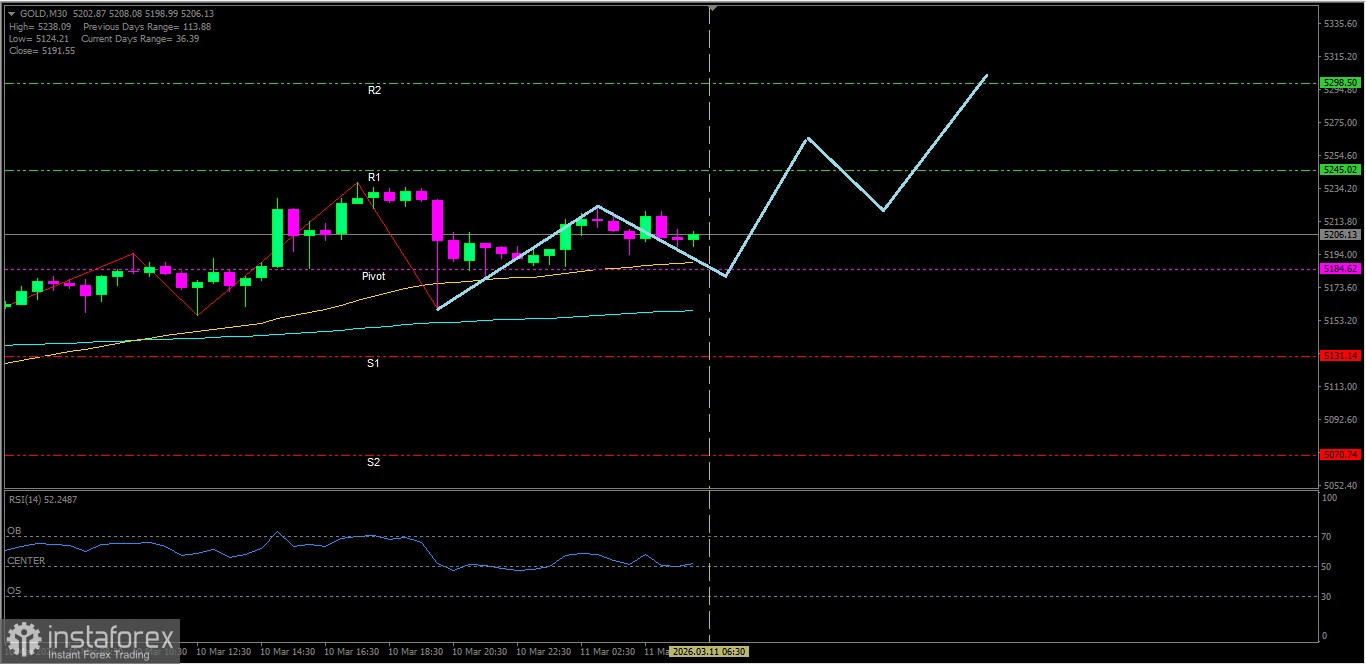
With EMA(50) and EMA(200) condition in a Golden Cross intersection and RSI(14) indicator in the Neutral-Bullish area, then Gold is likely to test its nearest resistance level in the near term.
Key Levels
1. Resistance. 2 : 5298.50
2. Resistance. 1 : 5245.02
3. Pivot : 5184.62
4. Support. 1 : 5131.14
5. Support. 2 : 5070.74
Tactical Scenario
Positive Reaction Zone: If the price holds at 5184.62, Gold is likely to move up toward 5245.02.
Momentum Extension Bias: If 5245.02 is broken, Gold could continue higher to test 5298.50.
Invalidation Level / Bias Revision
The upside bias weakens if Gold falls below 5070.74.
Technical Summary
EMA(50) : 5188.51
EMA(200): 5159.06
RSI(14) : 50.54
Economic News Release Agenda:
Today the United States will release the following economic data:
US - Core CPI m/m - 19:30 WIB
US - CPI m/m - 19:30 WIB
US - CPI y/y - 19:30 WIB
US - Crude Oil Inventories - 21:30 WIB
US - 10-y Bond Auction - 00:01 WIB
US - Federal Budget Balance - 01:00 WIB
*El análisis de mercado publicado aquí tiene la finalidad de incrementar su conocimiento, más no darle instrucciones para realizar una operación.
¡Los informes analíticos de InstaSpot lo mantendrá bien informado de las tendencias del mercado! Al ser un cliente de InstaSpot, se le proporciona una gran cantidad de servicios gratuitos para una operación eficiente.


